The June jobs release points to a split in the U.S. labor market: payrolls are still expanding, but household-based employment measures have weakened since the start of the year. That divergence makes the headline gain less reassuring than its positive sign suggests. It also complicates the usual shorthand of treating one monthly payroll number as a clear read on hiring momentum. The two surveys measure employment differently, so a gap between them can persist without either series being meaningless.
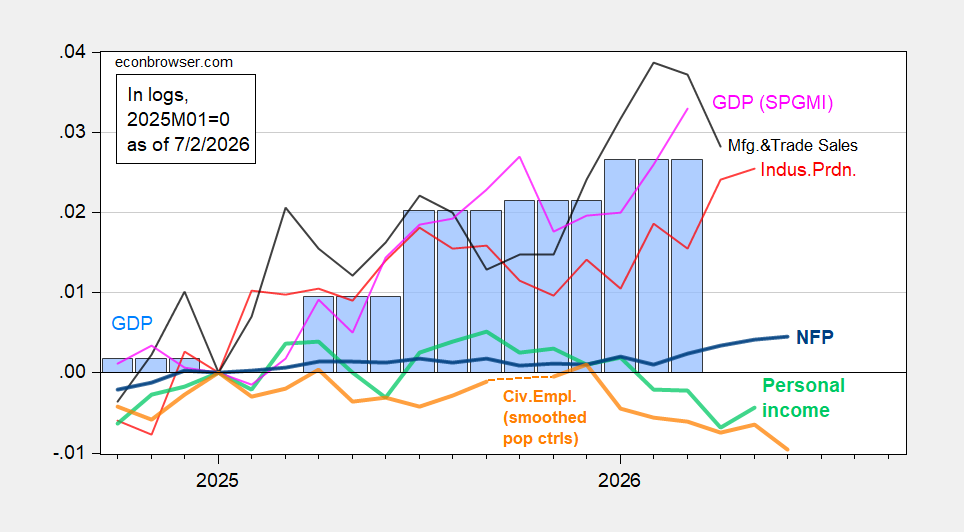
Figure 1: Nonfarm payroll employment (bold blue), civilian employment with smoothed population controls (bold orange), industrial production (red), real personal income excluding current transfers (bold light green), real manufacturing and trade sales (black), and monthly GDP (pink), with quarterly GDP shown as blue bars. Series are log normalized to 2025M01=0. The chart brings employment alongside production, income, sales, and output measures, which can move at different speeds. Read together, they show why a single payroll release can’t settle the question of the economy’s direction. Source: BLS via FRED, BLS, Federal Reserve, BEA 2026Q1 third release, S&P Global Market Insights (formerly Macroeconomic Advisers, IHS Markit; 5/7/2026 release), and author’s calculations.
Nonfarm payrolls increased by 57,000, well below the 114,000 consensus. The gain remains above the level associated with a stable unemployment rate, but revisions to prior months were downward. Private payrolls also undershot expectations: BLS reported a 59,000 increase against a 110,000 forecast, while ADP’s private payroll measure also came in below consensus. Weakness therefore wasn’t confined to government employment.
The difference between the reported gain and the consensus is sizable enough to draw attention, but a miss against a forecast isn’t itself proof of contraction. Payrolls still rose, and the stated comparison with the level associated with a stable unemployment rate argues against reading the release as an outright reversal. The more telling point is the combination of a smaller gain and downward revisions: the recent pace looks less firm when earlier estimates are revised lower. This is more significant than it looks. A labor market can keep adding jobs while losing momentum, and that distinction matters for anyone trying to assess whether demand for workers is broadening or cooling.
Household measures point to a downshift
The household survey is noisier month to month, yet civilian employment has been trending lower. A version adjusted to the nonfarm payroll concept also declines from the beginning of the year, using the same population controls. That makes the direction harder to dismiss as a measurement difference alone.
These measures aren’t interchangeable. The establishment survey counts jobs reported by employers, while the household survey tracks employed people; one person with more than one job can affect the two series differently. The household estimate also tends to fluctuate more from month to month, so short runs can be misleading. Here’s the thing: the adjusted series is useful because it attempts to align the household measure with the payroll concept, and it still points down. That doesn’t eliminate uncertainty, but it weakens the case for explaining the entire gap as a survey quirk.
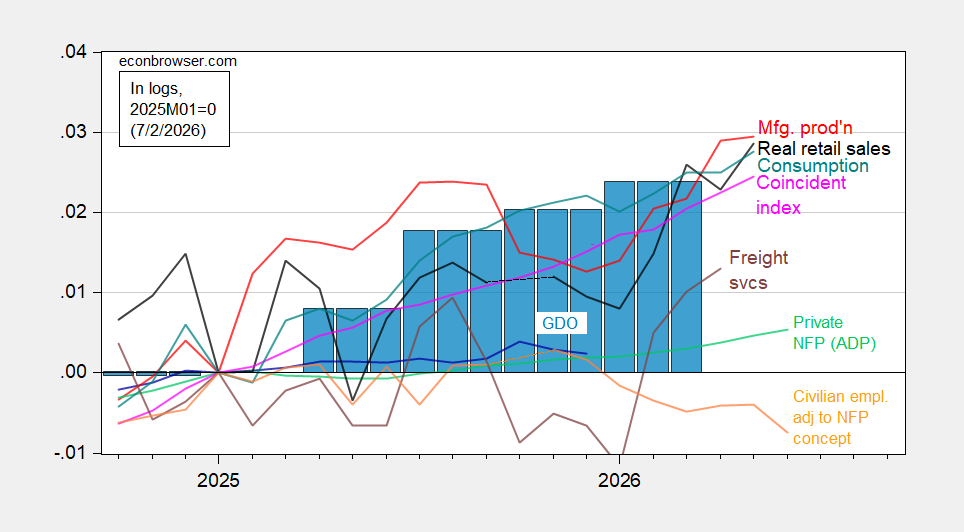
Figure 2: Civilian employment adjusted to the nonfarm payroll concept with smoothed population controls, including experimental 2025 controls (bold orange), manufacturing production (red), ADP private nonfarm payroll employment (light green), real retail sales (black), freight services indexes (brown), and the coincident index (pink), with GDO shown as blue bars. Series are log normalized to 2025M01=0. The comparison puts person-based employment next to activity measures that capture production, spending, freight, and broader economic conditions. These series can diverge because they track different parts of the economy and use different inputs. Source: BLS, ADP via FRED, Philadelphia Fed, Bureau of Transportation Statistics, Federal Reserve via FRED, BEA 2026Q1 third release, and author’s calculations.
The coincident index is growing more slowly than official GDP and S&P Global Market Insights’ monthly GDP estimate. Its reliance on labor-market indicators helps explain the gap with output-based measures. The data therefore offer different readings of current momentum: output is holding up better than employment-linked measures.
That divergence is a reminder that GDP and employment answer related but distinct questions. Output can remain comparatively strong even as firms add fewer workers, especially when productivity or hours worked change; the information here doesn’t establish which mechanism is at work. The coincident index, because it includes labor-market indicators, may naturally echo a softer employment picture more quickly than measures centered on production. And yet, the contrast deserves attention: output strength alone doesn’t show that hiring conditions are equally strong. If you’re working in this space, watch whether the gap narrows as more monthly data arrive.
Revisions could alter the payroll picture
Payroll growth remains intact in the establishment survey, and revisions may change the latest estimate. In 2025, the mean absolute revision to monthly employment changes between the first and third releases was 53,000; the second release could still move the June figure upward. That possibility doesn’t erase the decline in the number of people employed shown by the household-based series.
The historical revision figure gives a sense of the uncertainty around an early estimate, not a forecast of the direction of the next change. A revision could lift the June gain, but the same general issue applies to the earlier months that were revised downward. It’s a reason to avoid treating the first print as final. It isn’t a reason to set aside the household trend, which measures a different aspect of employment and currently points to fewer people working.
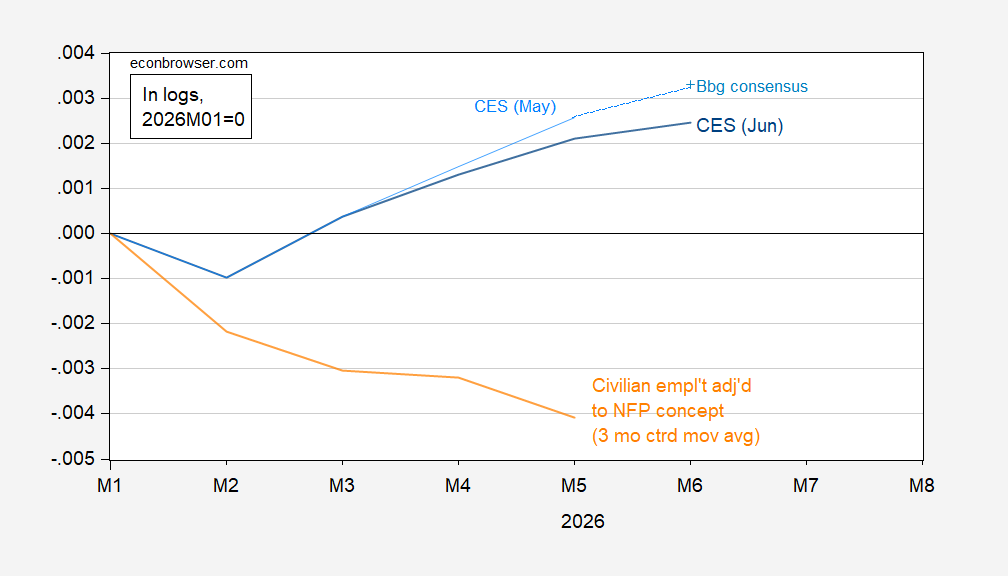
Figure 3: Nonfarm payroll employment in the June release (blue) and May release (light blue), Bloomberg consensus (light blue plus signs), and civilian employment adjusted to the nonfarm payroll concept as a three-month centered moving average (orange). Series are in logs, normalized to 2026M0=0. The figure compares the latest payroll estimate with the prior release and a smoothed household-based series. The moving average reduces some month-to-month noise, though it can also make turning points appear gradually. Source: BLS and author’s calculations.
What the split means for the outlook
The clearest signal is a downshift in employment growth. Payroll gains show continued expansion, while the trend in employment measured by persons has turned lower. Whether revisions narrow that divide will matter for judging the labor market’s underlying momentum.
For now, the evidence supports a measured reading: hiring hasn’t stopped, but the headline payroll increase doesn’t tell the whole story. The surveys differ in construction and each carries uncertainty, so the gap should be tracked across releases rather than resolved by choosing whichever number looks stronger. The next revisions and subsequent employment readings will help show whether the household decline persists and whether payroll growth remains subdued. The distinction is practical. Still expanding, but with less force.