Why the old comparison still matters
The latest global temperature series gives fresh context to an argument made in 2014: whether the record high that year was statistically distinct from an earlier one. With Madison and much of the eastern United States under prolonged heat advisories, the question can feel less like a dispute over chart interpretation and more like a question about what the data say about conditions people experience. But local heat and global annual averages describe different things, and neither can settle the other question by itself.
Rick Stryker questioned whether 2014 was meaningfully hotter than 2005. The difference he cited was 0.04°C over nine years. His point was about statistical separation: temperature anomalies contain measurement uncertainty and natural variation, so a small difference between two annual readings may not be enough to show that one year was distinctly hotter than the other. He called the argument “thin” himself, a useful qualification rather than a reason to dismiss the underlying issue.
That distinction matters. A record ranking asks which reported value is highest; a statistical test asks whether the gap between values is large relative to uncertainty and variability. Those questions overlap, but they aren't identical. Two years can occupy different positions in a table while remaining difficult to distinguish statistically, depending on the data and the method used.
A longer record changes the frame
The chart below updates the global temperature series through May 2026, drawing on NOAA data accessed July 3, 2026. A comparison between 2014 and 2005 captures only two points. The extended series gives readers a broader view of how those points sit among the other observations, and whether attention to a close pair of years obscures a longer pattern.
Global temperature anomalies express temperatures relative to a reference period. They aren't direct readings of the temperature at every location, and an anomaly doesn't mean every place warmed by the same amount. The measure is useful because it allows observations across different locations and time periods to be compared against a common baseline. The precise construction of a series still depends on the underlying observations and the methods used to combine them.
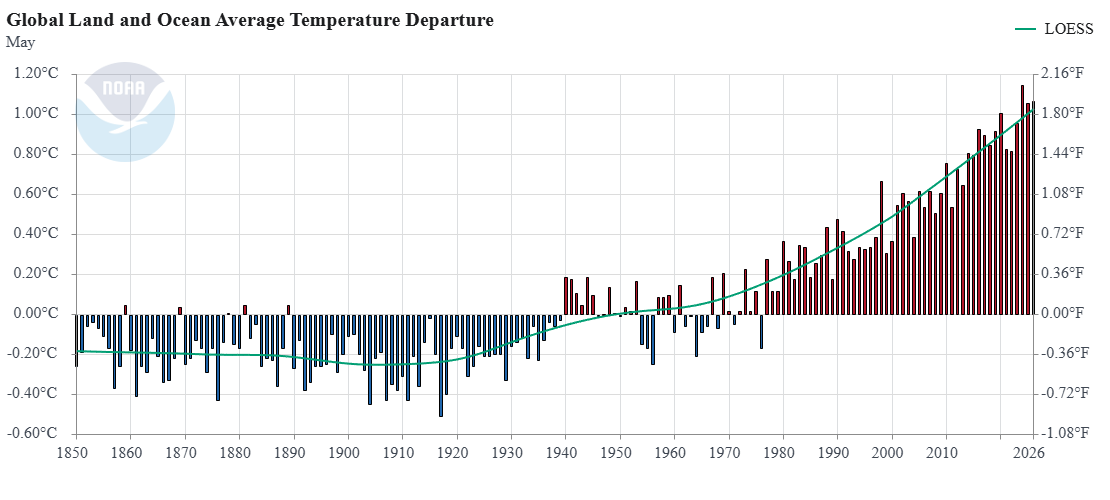
Source: NOAA, accessed 7/3/2026.
The chart invites a simple question: where has Rick Stryker gone? The more useful takeaway is that a long record offers a wider basis for judging whether a focus on two individual years captures the direction of global temperatures. A chart can show sequence and scale, but a visual impression alone doesn't establish the statistical significance of a difference. That requires a clearly stated method and an account of the uncertainties relevant to the comparison.
What a two-year test can and can't tell you
Annual temperatures vary. Measurement systems have limits, and the way observations are assembled can affect the uncertainty around an estimate. Natural variability also means that one year can differ from the next even when the broader climate pattern is changing. A statistical test tries to account for such variation; it doesn't make the uncertainty disappear.
That makes the choice of comparison important. Testing whether 2014 differed from 2005 answers a narrow question about those two years. It doesn't, on its own, describe the full temperature history, explain the cause of any longer-term change, or establish what will happen next. The broader series helps with context, but conclusions still depend on what question the analysis is designed to answer.
Here's the thing: close rankings can attract more attention than the pattern around them. A debate over whether a small gap clears a statistical threshold may be technically legitimate, yet still leave readers with an incomplete picture if they treat the two selected years as a stand-in for the full record. The numbers here are underwhelming as evidence for a large difference between those two years; they don't settle the separate question of how the series behaves over a longer span.
And this is the part most people overlook: statistical uncertainty around an individual estimate doesn't mean every interpretation is equally well supported. It means the size and limits of the evidence should be described accurately. If you're working in this space, it helps to distinguish a record claim, a comparison between two years, and an assessment of a longer trend. Each needs its own evidence.
Implications for reading the updated series
The updated chart is useful because it places the old argument in a wider frame. It can help readers see whether 2014 and 2005 look like isolated high points or part of a broader sequence, while reminding them that a chart isn't a substitute for statistical analysis. The source identifies the data provider, the period covered, and the access date; those details help establish what series is being discussed and when it was retrieved.
The prolonged heat advisories in Madison and across much of the eastern United States add immediacy, but they don't turn a local episode into a global annual statistic. Weather conditions vary by place and over shorter periods; a global series summarizes a much larger domain and longer interval. Both can be relevant to climate discussion, but they answer different questions.
This is more significant than it looks: the old exchange illustrates how a narrow statistical objection can be mistaken for a conclusion about the entire record. Stryker's question about a 0.04°C difference deserves to be assessed on its own terms. The longer series supplies context for that assessment, while the interpretation still needs to respect uncertainty and the limits of a two-year comparison.
One small gap. A reason to examine the method, not a complete account of the record.