The Mag-7 index has fallen 12.2% from its May 29 peak, raising a question for business investment: could AI-related spending turn down if the equity decline persists? The comparison with the dot-com era offers a timing reference, but the funding picture differs. A share-price decline can affect corporate decisions through several channels: it may make equity financing less attractive, weaken confidence in expected returns, or prompt executives to reconsider projects whose payoffs depend on continued demand. None of those effects follows automatically from a market drop, however. The key issue is whether companies change their spending plans, not simply whether their stocks fall.
Bloomberg’s Mag-7 index could rebound if policy rates fall or policy uncertainty eases. If the May high holds, though, the 2000 sequence is worth watching: the stock market peaked at the end of 2000’s first quarter, followed by a peak in nonresidential fixed investment in the fourth quarter. That gap makes the earlier episode useful as a reference for timing, but it doesn’t establish that the same sequence will repeat. Investment plans are made and executed over time, so spending can keep rising after investors have begun marking down expected future profits. Here’s the thing: the lag is a reason to watch the data, not a forecast on its own.
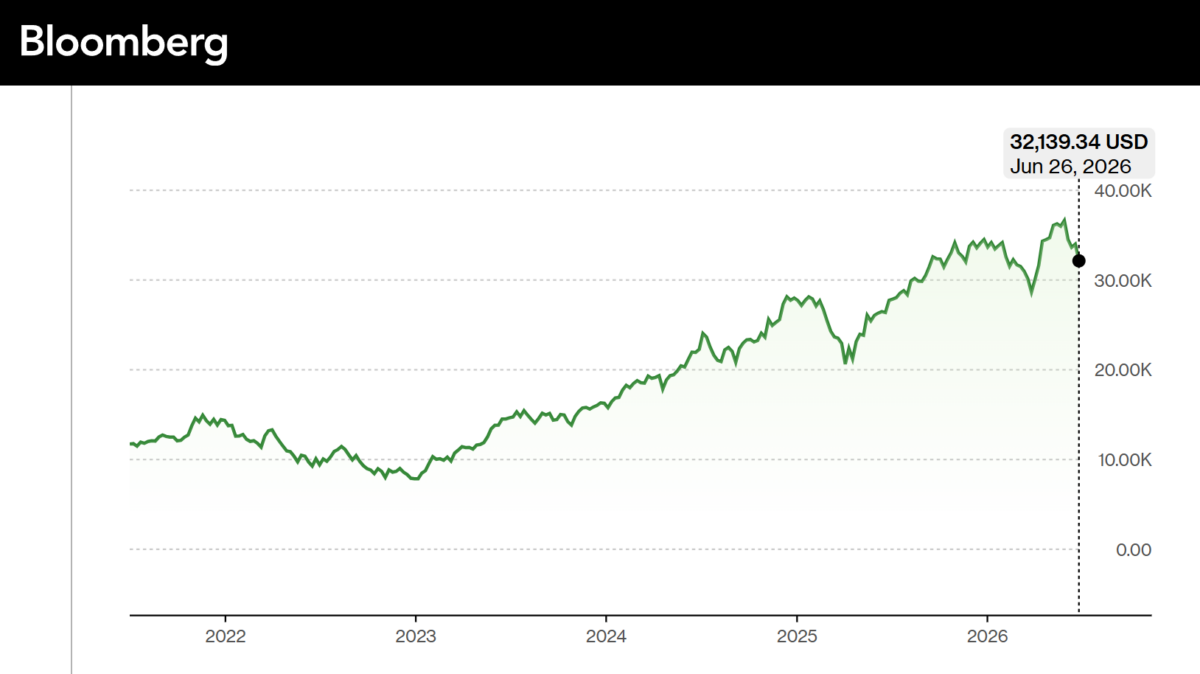
Source: Bloomberg.
Investment remains strong
Current spending data tell a different story from the share-price move. Investment in equipment and software has continued to rise, with the second-quarter 2026 estimate based on the Atlanta Fed’s GDPNow forecast dated July 2. That distinction matters: equity prices reflect investors’ changing expectations, while investment data record spending that has already occurred or is being estimated for the current quarter. The two measures can point in different directions for a time. A rising investment series shows that spending has held up so far; it doesn’t tell us whether planned projects will remain attractive if companies’ expectations change.
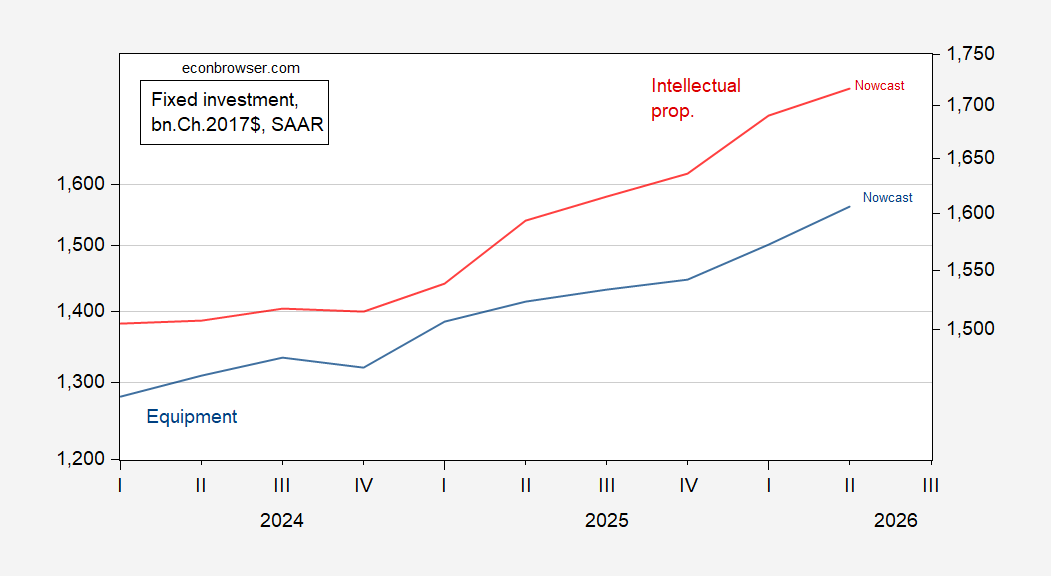
Figure 1: Nonresidential investment in equipment (blue, left log scale) and software (red, right log scale), in billions of chained 2017 dollars at a seasonally adjusted annual rate. Q2 is the GDPNow estimate as of July 2, 2026. Source: BEA, Atlanta Fed, and author’s calculations.
The dot-com analogy has limits. Most Mag-7 companies could fund investment from retained earnings, and large firms are only now turning to debt markets. That leaves a different financing backdrop from a cycle in which falling equity prices were followed by a sharp investment slowdown. When a company can draw on internal cash, a lower share price needn’t immediately constrain its ability to pay for equipment or software. But funding capacity and willingness to spend aren’t the same thing: management still has to believe expected returns justify the outlay. And yet, financing conditions are only one part of the decision. If projected demand weakens, even a well-funded company may reassess a project.
A possible lag to watch
If investment follows equity prices with a three-quarter delay, the historical comparison points to a potential turning point ahead. The chart aligns current nonresidential fixed investment with the 2000 episode, shifting the earlier series by 105 quarters and normalizing both to their peaks. The 2026 second-quarter figure is an Atlanta Fed GDPNow estimate. Normalizing each series to its peak helps compare the shape and timing of the two episodes, but it also strips away their absolute scale. Similar movements in a chart can be suggestive; they can’t establish that the causes are the same.
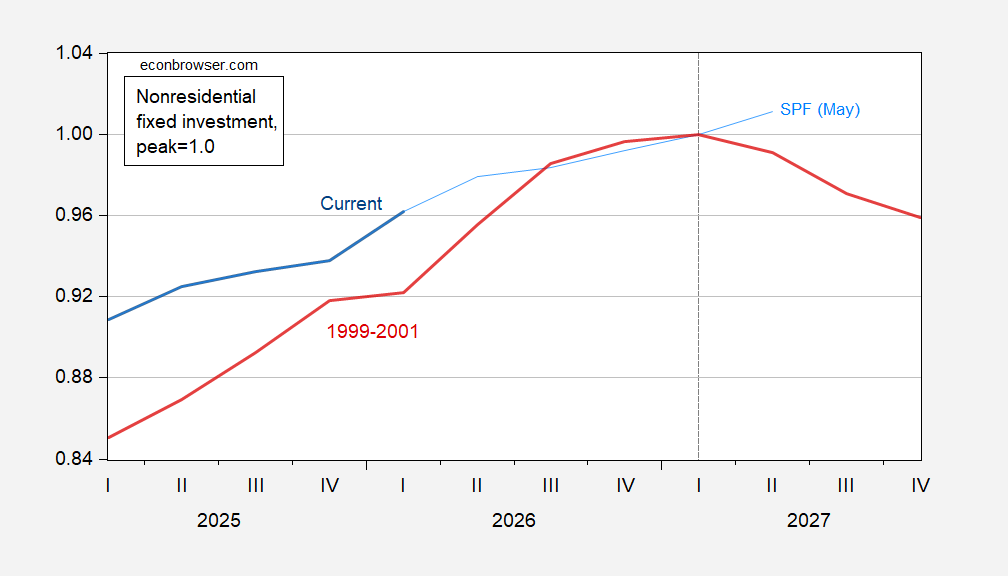
Figure 2: Nonresidential fixed investment, actual and SPF (blue), and the series lagged 105 quarters (red), both normalized to peak (2027Q1 and 2000Q4). 2026Q2 is the GDPNow estimate as of July 2. Source: BEA 2026Q1 third release, Atlanta Fed, and author’s calculations.
Professional forecasters expect investment to keep growing, while a lasting peak in AI-related shares could foreshadow a downturn. The next few quarters will show whether strong spending can outlast the market’s recent retreat. Forecasts provide a useful baseline, but they’re not a substitute for observing what firms actually do as budgets are revised. If you’re working in this space, the practical signals are whether equipment and software investment keeps rising and whether the forecasts hold as new data arrive. This is more significant than it looks: a sustained market decline would test whether current spending rests on durable business demand or on expectations that have become harder to justify.
What the comparison can—and can’t—tell us
The historical pattern gives readers a question to track, not a timetable to trust. The 2000 experience shows that investment can peak after share prices do, but the current figures describe a different financing backdrop and spending is still increasing. A single quarter’s estimate also carries uncertainty, particularly when it comes from a nowcast. The useful test is whether subsequent data confirm continued growth or begin to show a slowdown. The distinction between a market repricing and a change in capital spending is the whole story.