Why the timing changes the reading
Canada’s latest monthly employment and GDP observations point to Q2, not Q1, under the population controls used for civilian employment. That distinction affects how readers line up the May Labour Force Survey release with other measures of economic activity. A monthly series can show when a change appears in the data, but the interpretation depends on how the series is constructed and which population estimates underpin it.
Population controls are the estimates used to represent the size and composition of the population from which a survey’s employment results are drawn. When those controls change, the reported level of civilian employment can shift even if the underlying survey responses haven’t changed in the same way. The adjustment matters because employment counts are not simply a tally of every job: they’re estimates derived from a sample and scaled to represent a broader population.
That doesn’t make the Labour Force Survey unhelpful. It does mean that a turning point should be read with care. A reader looking only at the apparent month when one line begins to move could assign a change to the wrong quarter, especially when other indicators use different methods or are reported on a different schedule. The timing is the story here.
Reading the monthly measures together
The figure places three monthly series side by side: employment from the Labour Force Survey, nonfarm payroll employment from the Survey of Payroll, Employment and Hours, and monthly GDP. The employment series describe related parts of the economy, but they aren’t interchangeable. The Labour Force Survey measures employment through a household survey, while payroll employment comes from an employer-based survey. GDP, in turn, tracks economic output rather than the number of people working.
That difference matters when the series don’t move in lockstep. Household and payroll measures can diverge because they rely on different survey populations, definitions, and estimation processes. Output can also change for reasons that don’t produce an immediate, matching change in employment. A business may produce more or less with a similar workforce, while employment may respond to activity with a lag. These are general features of how such measures can relate; the figure alone doesn’t establish which mechanism explains any particular movement.
The lines are shown in logs and rebased so that 2025M10 equals zero. In this presentation, the chart emphasizes proportional movement from a common reference point rather than the raw number of workers or dollars in each series. That makes the directions and relative changes easier to compare visually, but it doesn’t turn the measures into direct substitutes. The vertical position of one line shouldn’t be read as a comparison of the absolute size of employment and GDP.
This is more significant than it looks. A quarterly narrative can change when a monthly indicator is assigned to a different part of the calendar, even if the underlying observations remain the same. And a graph that combines multiple series can make a timing question appear settled when it’s actually dependent on the population controls and measurement choices behind each line.
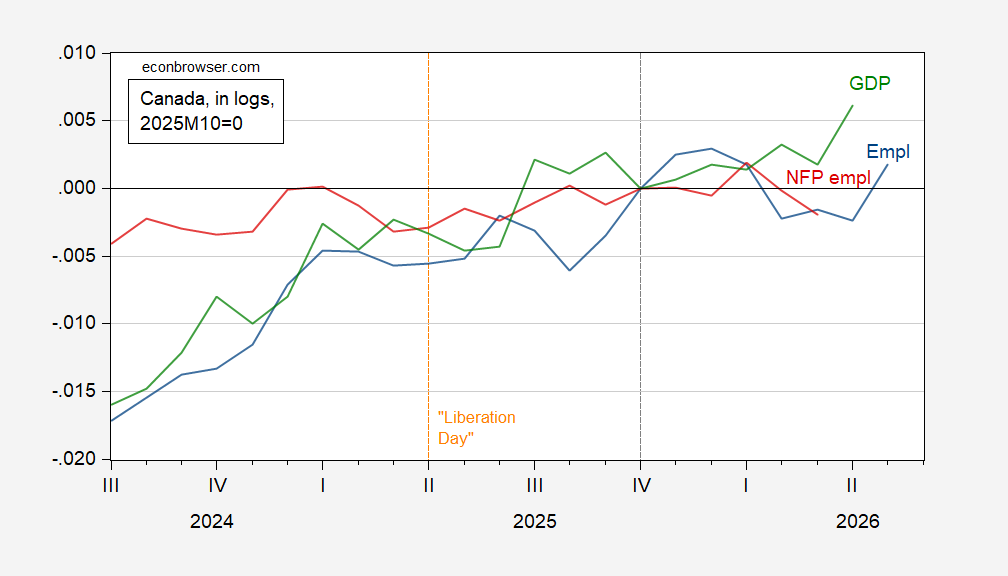
Figure 1: Monthly employment from the Labour Force Survey (blue), nonfarm payroll employment from the Survey of Payroll, Employment and Hours (SPEH) (red), and monthly GDP (green), shown in logs with 2025M10=0. Source: Statistics Canada and author’s calculations.
What quarterly indicators can add
The source points readers to quarterly indicators for a broader assessment, including final sales to private domestic purchasers, described there as equivalent to GDO, and personal income excluding transfers. These measures bring different information to the discussion. Final sales to private domestic purchasers focus attention on spending by domestic private buyers, while personal income excluding transfers offers a view of income that removes transfer payments from the measure.
No single indicator answers every question about the business cycle. Employment speaks to work and labour demand; payroll data provide a separate employer-based view; GDP tracks production; and income and final sales offer other angles on household resources and private demand. When the signals differ, that disagreement is useful information about uncertainty and measurement. It’s a reason to compare the evidence, not to force the series into a single clean story.
The linked post also provides a comparison with quarterly indicators and frames the issue through lessons from an earlier U.S. discussion. That reference offers context for why analysts may be cautious when interpreting GDP data, but it doesn’t by itself establish that Canada is in a recession or that a particular quarter marks one. The point supported here is narrower: the timing of the monthly employment and GDP observations depends on the population controls used for civilian employment, and the broader assessment draws on additional measures.
The C.D. Howe Institute’s Business Cycle Council likewise urges caution in its statement. That caution is relevant because business-cycle calls typically depend on a body of evidence and on how the data are interpreted, rather than on one monthly release. The statement is a signal that the latest GDP data shouldn’t be treated as a self-sufficient verdict. It doesn’t remove the need to inspect the underlying indicators.
Implications for the business-cycle picture
Here’s the thing: a shift in the quarter assigned to an observation can affect how readers describe momentum, but it shouldn’t be confused with a change in the observation itself. Analysts and business readers need to keep the timing convention visible when comparing monthly employment with quarterly output, income, or spending. If you’re working in this space, check which employment population controls are being applied before drawing a quarter-by-quarter conclusion.
(And this is the part most people overlook.) Different indicators can be internally sound and still appear to disagree because they measure different things, use different sources, or respond at different speeds. A comparison is strongest when those distinctions are explicit. A chart can organize the evidence; it can’t resolve a methodological question that its labels and underlying data leave open.
That said, the source offers a useful restraint: read the May Labour Force Survey alongside other business-cycle measures, and consider the quarterly evidence and the Council’s caution. The available material doesn’t support a definitive claim about the future path of Canadian activity. It does support a more careful reading of the present data, with particular attention to the population controls and to the quarter in which the employment signal is placed.
Not a verdict. A timing adjustment, and a reason to read across measures.
Figure 1: Monthly employment from the Labour Force Survey (blue), nonfarm payroll employment from the Survey of Payroll, Employment and Hours (SPEH) (red), and monthly GDP (green), shown in logs with 2025M10=0. Source: Statistics Canada and author’s calculations.
For a broader read, see the quarterly indicators, including final sales to private domestic purchasers (equivalent to GDO) and personal income excluding transfers, in this post. The C.D. Howe Institute’s Business Cycle Council also urges caution in its statement.