Recurring costs make inflation feel sharper
Inflation’s effect on household budgets looks sharper when measured against frequently recurring expenses. An estimate puts everyday prices up about 8.6% from January 2025, compared with a 4.7% increase in headline CPI. That’s a substantial difference in the story the measures tell: the broader index points to a notable rise in prices, while the everyday price estimate suggests a steeper climb in costs people encounter often.
The distinction is about the mix of expenses being tracked. A broad consumer index summarizes price changes across many categories, while an index focused on everyday prices can put more weight on purchases that recur frequently. Households don’t experience an average index directly; they experience rent, food, fuel, and other bills in the proportions their own budgets require. A measure that emphasizes recurring purchases may therefore capture a pressure that feels immediate even when it doesn’t represent every household’s total spending.
That doesn’t make the everyday price estimate a universal measure of household inflation. The estimate and headline CPI answer different questions, and neither one tells every family’s story. The useful point is the contrast: the reported increase depends in part on which prices are grouped together and how those prices are weighted. This is more significant than it looks, because the choice of measure also shapes how readers interpret wage gains.
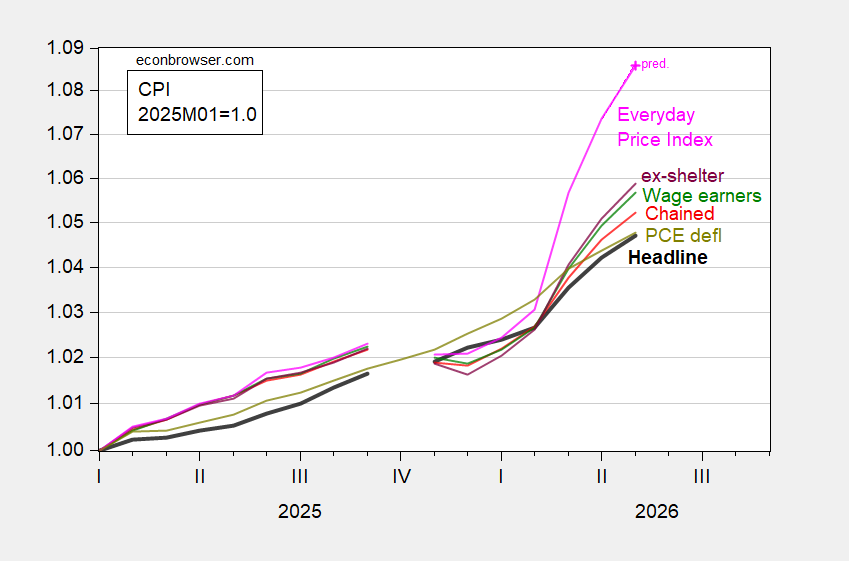
Figure 1: CPI-all urban (bold black), CPI wage earners and clerical (green), CPI ex-shelter (purple), CPI chained (red), PCE deflator (chartreuse), AIER Everyday Price Index (pink), all 2025M01=1.0, on log scale. Chained CPI is n.s.a. April AIER EPI is nowcasted using CPI and gasoline price changes. May PCE deflator is nowcasted as of 6/10. Source: BLS, BEA via FRED, AIER, Cleveland Fed, and author’s calculations.
The figure places several price measures on a common January 2025 starting point, making their subsequent paths easier to compare. The logarithmic scale is another part of how the chart presents change, so readers should focus on the stated movements and the relative direction of the lines rather than treating the display as a household budget calculator. The measures cover different concepts, and their differences are informative precisely because they aren’t interchangeable.
The chart also includes estimates rather than final observations for some of its latest readings. The caption says April’s AIER Everyday Price Index is nowcasted using CPI and gasoline price changes, and May’s PCE deflator is nowcasted as of 6/10. Those estimates help extend the comparison to a more recent point, but they carry a different status from a fully reported observation. That distinction matters when readers weigh small changes or draw conclusions from the latest portion of a line.
Different households face different price mixes
The CPI for wage earners and clerical workers has accelerated more than the index for all urban consumers. That gap matters for households whose spending is concentrated in daily or weekly purchases, though the figure’s CPI comparison represents a household around the 70th income percentile. The percentile detail is a useful constraint on interpretation: the chart’s comparison shouldn’t be read as a direct description of the budget of every worker or family.
Even within a group, spending patterns vary. Two households can face the same published inflation rate and still notice different pressures, depending on which expenses take up the largest share of their budgets and how often they pay them. A frequently purchased item can stay salient because its price is encountered repeatedly; a less frequent expense may still matter greatly to the household’s finances, even if it doesn’t shape the day-to-day impression of inflation as strongly.
Here’s the thing: the gap between indexes isn’t proof that one is right and the others are wrong. It shows that the answer depends on the question. If you’re working in this space, the income percentile and the index’s spending focus belong beside any headline comparison, not buried in a caption. Without that context, a precise-looking percentage can imply more universality than the data support.
Real wages depend on the price measure
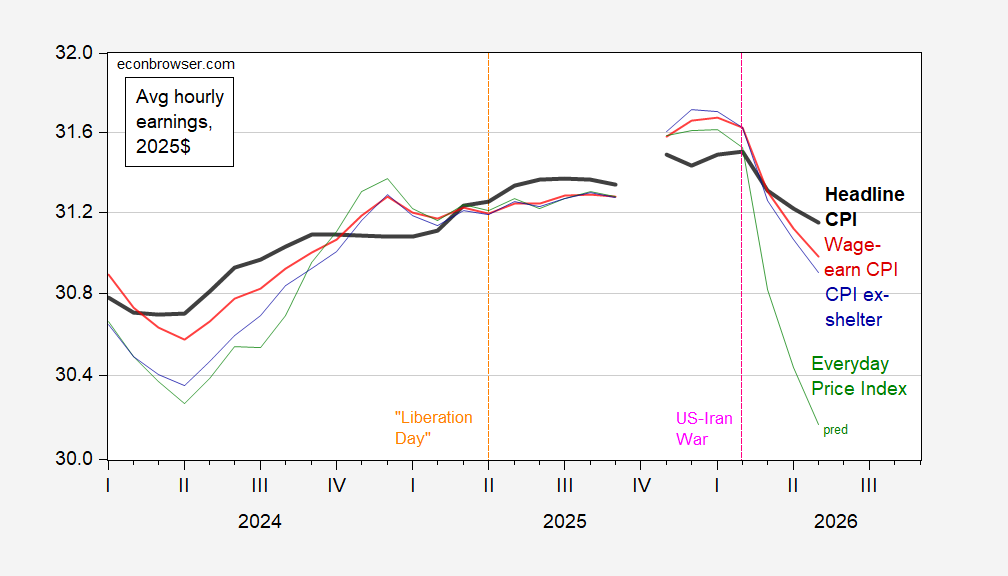
Figure 2: Average hourly wage in 2025$ using headline CPI (bold black), wage earner and clerical worker CPI (red), CPI ex-shelter (blue), and Everyday Price Index (green). May Everyday Price Index estimated using reported CPI and gasoline price changes. Source: BLS, AIER, and author’s calculations.
Deflated by headline CPI, average hourly earnings have returned to January 2025 levels. Using the wage-earner index puts them 0.7 percentage points lower; using the Everyday Price Index implies a 3.4% decline. The choice of deflator therefore changes the picture of household purchasing power, with recurring costs indicating a steeper squeeze.
Deflating wages means adjusting the nominal pay measure for changes in prices. It’s a straightforward operation, but the result depends on the price series selected. Here, the headline CPI comparison suggests that average hourly earnings have recovered their January 2025 level, while the other measures shown put real earnings below that benchmark. The Everyday Price Index produces the largest stated decline among the comparisons in the text.
That gap deserves attention, but it shouldn’t be mistaken for a direct measure of what every worker can afford. Average hourly earnings are an average, and a price index is a summary of prices; neither captures the exact pay and spending mix of a particular household. The figures support a narrower conclusion: by the headline measure, average hourly earnings have regained ground, while measures more sensitive to other price mixes show less recovery.
And yet. A return to a starting level under one deflator doesn’t mean the earlier rise in costs has vanished from household experience. Nor does a decline under another measure, by itself, establish how every household’s finances have changed. The comparisons are best read as evidence that purchasing power is sensitive to the prices used in the calculation.
What the comparison implies
For readers assessing the wage picture, the choice of deflator is part of the analysis, not a technical footnote. Headline CPI offers a broad benchmark; the wage-earner and clerical index and the Everyday Price Index produce weaker real-wage readings in the figures described here. That spread shows why a single “real wage” figure can conceal meaningful differences in the inflation households are being asked to absorb.
The nowcasted observations add another reason to keep the claims measured. The caption identifies estimates for the April Everyday Price Index and May PCE deflator, and the second figure’s May Everyday Price Index is estimated using reported CPI and gasoline price changes. Those inputs give the charts a recent endpoint, but the resulting estimates depend on the stated method. They’re useful context, not a reason to overstate precision.
For now, the evidence presented points to a clear tension: average hourly earnings have returned to January 2025 levels when adjusted by headline CPI, while recurring-price measures imply a sharper loss of purchasing power. That doesn’t settle which index best reflects any one household. It does show why the headline figure alone can leave out part of the pressure people encounter in routine spending. A wider squeeze, depending on the basket.