The headline rebound in inflation-adjusted retail sales masks softer recent momentum in a narrower measure. Sales excluding autos, auto parts and gasoline have decelerated over the past two months, even as total CPI-deflated retail sales recovered. Those measures answer different questions: the broad total captures a wider range of consumer purchases, while the narrower series removes categories that can make the monthly picture more volatile. A rebound in the total therefore doesn't, by itself, show that spending has strengthened evenly across retail.
That distinction matters because retail sales are often read as a quick gauge of household demand. But a single broad measure can conceal changes in composition. Auto purchases and gasoline spending may shift for reasons that don't map neatly onto demand for other goods, so excluding them can help identify whether activity elsewhere is keeping pace. The narrower measure isn't a complete account of household spending, either; it offers a different lens, not a final verdict on consumers.
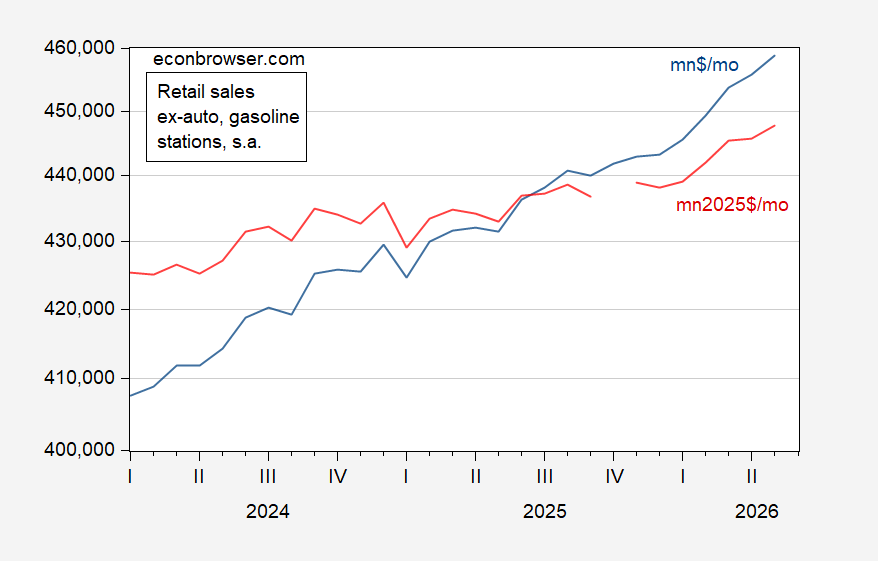
Figure 2: Monthly retail sales excluding autos and gasoline stations, shown in nominal millions of dollars (blue) and in 2025 dollars (red), seasonally adjusted. Real sales are deflated using core CPI. Source: Census via FRED, BLS, and author’s calculations.
What the narrower sales measure shows
The figure compares nominal sales with an inflation-adjusted version of the same measure. Nominal figures reflect both the quantity of goods sold and the prices paid; deflation is intended to make changes in purchasing volume easier to see. That adjustment depends on the price index used. Here, the calculation uses core CPI, so readers should treat the real series as an estimate shaped by that choice rather than a direct count of units sold.
The reported deceleration over the past two months is a change in pace, not evidence on its own that sales have contracted. That distinction is easy to lose when a chart is described in terms of momentum. A slower increase can still leave activity above an earlier level, while a short run of monthly readings can be affected by seasonal adjustment and ordinary data volatility. The useful question is whether subsequent releases confirm the loss of speed.
This is more significant than it looks because the broad rebound and the narrower slowdown can coexist without either series being wrong. The total may be lifted by categories that the narrower measure excludes, while purchases in the remaining categories cool. The split points to unevenness in the retail data; it doesn't establish why that unevenness emerged or whether it will persist.
Reading the broader business-cycle comparison
The broader business-cycle comparison tracks civilian employment adjusted to the nonfarm payroll concept, manufacturing production, ADP private payrolls, real retail sales, freight services, a coincident index and gross domestic output. The series are log-normalized to January 2025, highlighting their relative movements rather than their levels. This presentation helps readers compare direction and relative change across indicators measured in different units.
Normalization has a trade-off: setting each series to a common starting point makes movements easier to compare, but it removes the original scale. A line's position in this chart shouldn't be read as showing that one sector is larger than another, or that a given amount of movement has the same economic meaning across all series. The figure is about change from a shared reference point.
The indicators also capture different parts of economic activity and arrive through different measurement systems. Employment series speak to labor-market conditions, manufacturing production to factory output, and freight measures to activity in transportation services. Retail sales provide a consumer-facing view, while a coincident index and gross domestic output offer broader summaries. Agreement across several measures can strengthen a reading of the cycle; divergence can signal that the underlying economy is uneven or that the indicators are registering different aspects of it.
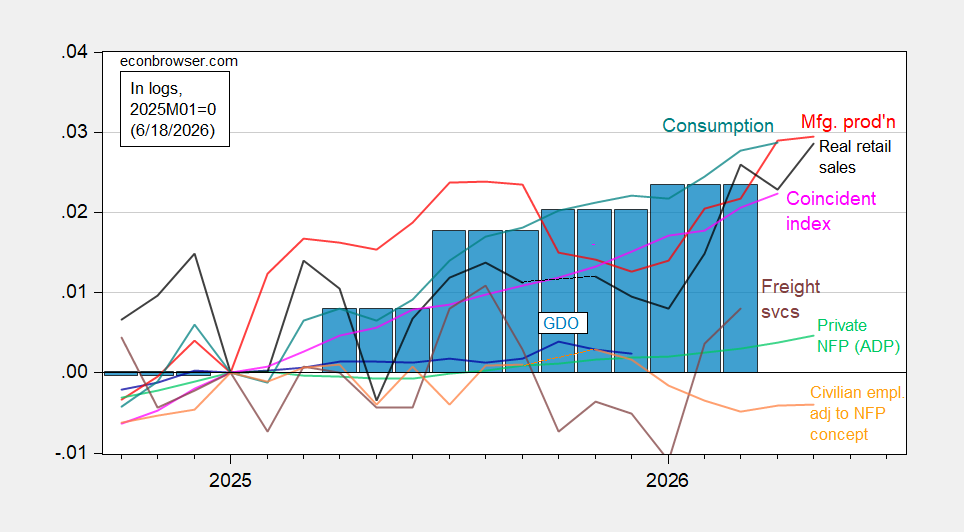
Figure 1: Civilian employment adjusted to the nonfarm payroll concept with smoothed population controls (bold orange), manufacturing production (red), ADP private nonfarm payroll employment (light green), CPI-deflated real retail sales (black), freight services indexes (brown), the coincident index in 2017 dollars (pink), and gross domestic output (blue bars), all log-normalized to January 2025 = 0. Source: BLS, ADP via FRED, Philadelphia Fed, Bureau of Transportation Statistics, Federal Reserve via FRED, BEA 2026Q1 second release, and author’s calculations.
The chart's mix of labor, production, freight and spending measures is useful precisely because no single series carries the whole business-cycle story. Yet it also calls for care: the inputs have different definitions, and the employment measure described here has been adjusted to align with the nonfarm payroll concept. The chart presents a comparison constructed from those series, not a single official measure of economic health.
What to watch in the next retail data
The split between the broad rebound and the recent slowdown in sales excluding autos and gasoline is a useful signal to watch in the next retail data. If you're working in this space, the practical issue is whether the narrower measure continues to lose pace, stabilizes, or turns back up—and whether the broader series moves in the same direction. One release may add information, but the pattern across releases will be more revealing.
And this is the part most people overlook: inflation adjustment and category selection both shape the story. The core-CPI deflator affects the estimated real movement, while excluding autos and gasoline changes which purchases are represented. Neither choice makes the series useless; each sets boundaries on what it can support.
Here's the thing: the rebound in total real retail sales is encouraging as a description of that aggregate, but it doesn't settle the question of how broadly consumer-facing activity is strengthening. The narrower measure is a counterweight to an overly simple reading, not proof that the rebound is fading across the economy. More data will show whether the two-month slowdown is sustained. For now, a mixed signal.