Why daily tracking matters
Geopolitical risk can shift quickly, making high-frequency measures useful for interpreting events and market conditions. Matteo Iacoviello and coauthor Jonathan Tong have developed AI-GPR, an index built with large language models that adds daily tracking to the existing Caldara-Iacoviello geopolitical risk measure. Their paper and index data are available online.
The case for tracking risk daily is straightforward: geopolitical news can change faster than many conventional indicators are updated. A monthly or quarterly measure may be useful for studying broad patterns, but it can blur the timing of a sudden shift. Daily observations offer a closer view of when attention to geopolitical risk rises or recedes, which may help researchers compare the measure with other fast-moving information.
That frequency comes with a trade-off. A daily index can react to short-lived bursts of news, while a slower series may smooth them away. Neither view is automatically more informative; each answers a different question. AI-GPR adds a higher-frequency lens to the existing Caldara-Iacoviello measure, giving analysts another way to examine changes in the period between less frequent observations.
Here's the thing: the index is a measure of geopolitical risk, not a direct gauge of economic damage or market losses. A rise can indicate that relevant material is receiving greater attention, but it doesn't by itself establish how firms, households, or investors will respond. That distinction matters whenever a headline number is used to explain prices or economic decisions.
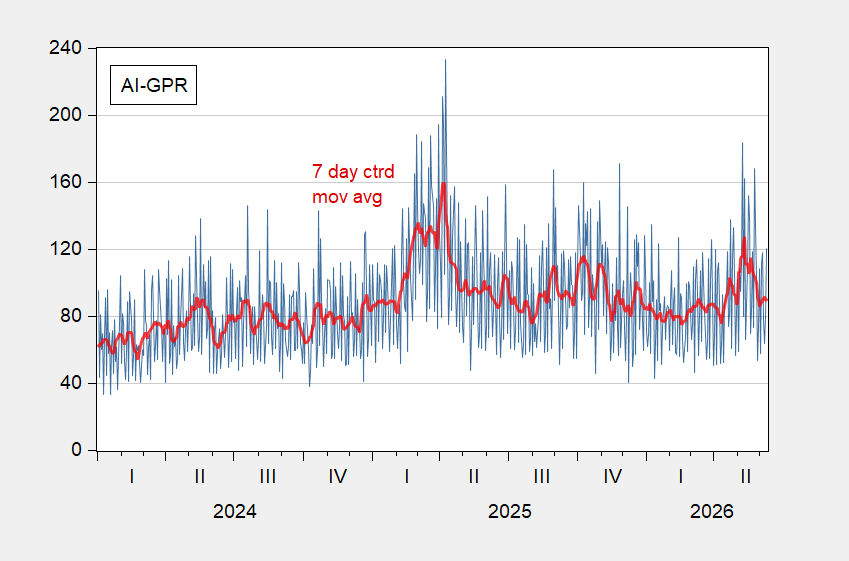
Figure 1: AI-GPR (blue) and its centered seven-day moving average (red). Source: matteoiacoviello.com.
The figure pairs the daily AI-GPR series with a centered seven-day moving average. The smoothed line can make a broader movement easier to see when daily readings fluctuate, while the underlying series preserves shorter-term variation. Because the average is centered, it summarizes observations around each point rather than serving as a purely real-time signal. Readers using the chart to assess timing should keep that feature in mind.
Risk measures by topic and relationship
The project also provides measures focused on geopolitical risk tied to Middle East oil, as well as oil-related risk more broadly. These series can help distinguish shifts in energy-linked tensions from movements in the headline index.
That separation is useful because a broad geopolitical measure can combine developments with very different economic channels. Energy-related tensions may matter through concerns about supply, costs, or uncertainty, while other geopolitical events may operate through different routes. Topic-specific series let researchers ask whether changes in the aggregate measure coincide with changes in a particular area. They don't, by themselves, show that one development caused another.

Figure 2: GPR-oil-MiddleEast (blue) and its centered seven-day moving average (red). Source: matteoiacoviello.com.
The Middle East oil series applies that narrower focus to a subject where geopolitical developments and energy concerns can intersect. Its value is comparative: an analyst can examine whether movement in this series appears alongside movement in the broader index, or whether the two diverge. A divergence may be analytically interesting, but interpreting it still requires looking at the underlying events and the way the measures are constructed.
There’s a limit to what a specialized index can settle. A topic label helps organize the evidence, but it doesn't turn a complex event into a single economic mechanism. Energy markets respond to a range of conditions, and the index alone can't tell a reader how much of any change in prices or activity should be attributed to geopolitical risk. A useful signal. Not a complete explanation.
Country and bilateral detail
Breakdowns by risk type, country and bilateral relationship make the data relevant to cross-country analysis. The US-China/China-US series, for example, tracks the relationship using a three-month moving average of daily data.
This level of detail can help researchers distinguish a change associated with one relationship from a broad rise in geopolitical attention. It also creates a basis for comparing the same relationship over time or examining how country-specific readings move alongside the headline index. Those comparisons can sharpen a research question, though they don't answer it on their own.

Note: Three-month moving average of daily data. Source: matteoiacoviello.com.
The three-month moving average changes the reading experience: it emphasizes sustained movement and reduces the prominence of individual daily swings. That can be helpful when the question concerns the direction of a relationship over a period, but it may conceal the exact timing of a brief surge. If you're working in this space, the choice between daily data and a smoothed series should follow the question you're trying to answer.
(And this is the part most people overlook.) More detail creates more opportunities to compare series, but also more choices about which measure and time window to emphasize. A country-specific or bilateral index can look persuasive when viewed in isolation; its meaning is stronger when the reader can see how it relates to the broader measure and what smoothing has been applied.
What the recent decline can and can't show
The author observes that the index has fallen over the past few months of the Trump 2.0 administration. The added topic and country detail gives researchers a way to examine where geopolitical risk is changing, and how those shifts relate to energy and bilateral ties.
A decline in the index is a description of the series over the period cited. It doesn't establish that geopolitical risks have disappeared, nor does it say that every category or relationship has moved in the same direction. The more granular measures may help test those questions, but the available description doesn't provide a full account of the causes behind the decline.
This is more significant than it looks: the project combines higher-frequency tracking with ways to separate risk by topic and relationship. That combination can make research more precise, especially when analysts want to study timing or compare categories. Its usefulness will depend on how clearly users understand the index definitions, smoothing choices, and limits of what the readings represent.
The next step for readers is careful comparison, not treating any one line as a verdict. Daily measures can locate movement; averages can make persistent patterns easier to read; and topic or bilateral series can point to where a change is concentrated. Taken together, these views offer a richer account of geopolitical risk, while leaving the economic consequences to be established with additional evidence.