Consumption strength in a broader cycle
Consumption growth remains strong in the latest business-cycle indicators, even as the broader data set tracks activity across employment, production, income, sales and freight. The figures extend the assessment of GDP growth with alternative measures of current conditions. That distinction matters: GDP offers a broad accounting of economic activity, while monthly indicators can show whether its underlying components are moving together or pulling in different directions.
The first comparison puts several measures on the same chart, with each series log normalized to January 2025. This makes changes in the paths easier to compare from a common starting point, though it doesn't make the measures interchangeable. Payroll employment counts jobs reported by employers; civilian employment comes from a separate survey of households. Industrial production, income excluding current transfers, and real sales each capture a different part of the economy. Agreement across them can strengthen the case that activity is broad, while divergence can signal that a headline reading needs more careful interpretation.
Consumption strength is a useful signal, but it isn't a complete account of economic momentum. Households' spending is one channel through which activity reaches businesses, production and jobs; the other series help show whether that demand is accompanied by income, employment and output. Here's the thing: a strong reading in one category can coexist with softer conditions elsewhere. The chart's value is in showing those relationships, not in making every line tell the same story.
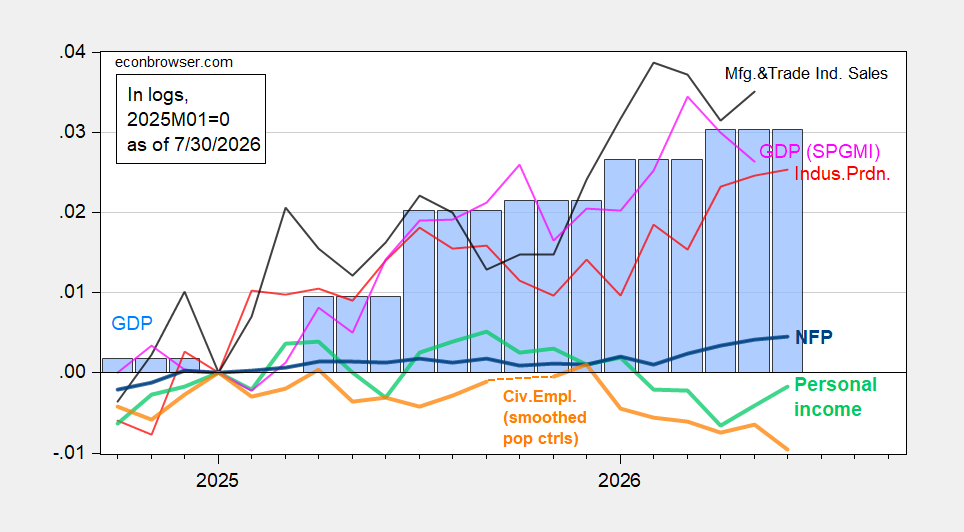
Figure 1: Nonfarm payroll employment (bold blue), civilian employment with smoothed population controls (bold orange), industrial production (red), real personal income excluding current transfers (bold light green), real manufacturing and trade sales (black), and monthly GDP (pink); GDP is also shown in blue bars, with the July 10 GDPNow estimate in a light blue box. Series are log normalized to January 2025. Sources: BLS via FRED, BLS, Federal Reserve, BEA’s 2026 Q1 advance release, S&P Global Market Intelligence (July 1, 2026 release), and author’s calculations.
What the second comparison adds
A second comparison adds private payrolls, retail sales and transportation measures to the employment and production picture. These alternatives help show whether the strength in consumption is reflected across other parts of the economy. The added series widen the test: retail sales offer a direct view of goods spending after adjustment for consumer prices, while freight measures can provide clues about the movement of goods and services through the economy.
Each measure still has its own limits. ADP private payroll employment and the government’s employment measures are produced using different methods, so a gap between them wouldn't, on its own, settle which one better describes the labor market. Freight indexes, meanwhile, represent transportation activity rather than the full volume of economic demand. The comparisons are most useful as cross-checks. A single indicator can be noisy or narrow; several measures pointing in a similar direction make a broader reading more persuasive, though they don't eliminate uncertainty.
Retail sales are deflated by the consumer price index in this chart, which helps distinguish changes in the amount spent from changes in prices. Even then, retail sales don't capture every form of household consumption. The figure also includes manufacturing production, adjusted civilian employment, and a real coincident index, with GDO shown separately in blue bars. That mix helps readers compare activity measures with different coverage and construction.
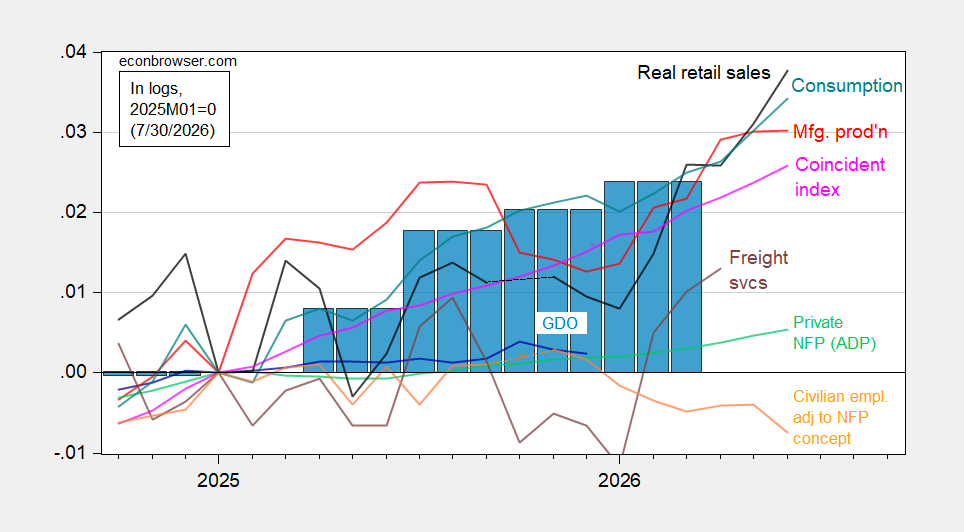
Figure 2: Civilian employment adjusted to the nonfarm payroll concept with smoothed population controls, including experimental 2025 controls (bold orange), manufacturing production (red), ADP private nonfarm payroll employment (light green), CPI-deflated retail sales (black), freight services indexes (brown), and the real coincident index (pink); GDO is shown in blue bars. Series are log normalized to January 2025. Sources: BLS, ADP via FRED, Philadelphia Fed, Bureau of Transportation Statistics, Federal Reserve via FRED, BEA’s 2026 Q1 third release, and author’s calculations.
Reading the signals with care
This is more significant than it looks: the comparison asks whether the apparent strength in consumption has company in the rest of the data. But the captions identify several releases and estimates, including a GDPNow estimate and BEA releases for the first quarter of 2026. Those are inputs to an assessment, not a guarantee that every series measures the same period or will be revised in the same way. The charts should be read as a snapshot built from distinct sources, each with its own scope and update schedule.
There’s also a baseline to keep in mind. Because the series are normalized to January 2025, the figures emphasize relative movement since that point; they aren't a direct comparison of the underlying dollar amounts, job counts or production levels. A line's position against another is therefore about its indexed path, not its absolute scale. And this is the part most people overlook: a visual comparison can clarify direction while obscuring differences in what is being counted.
If you're working in this space, the practical question is whether the employment, income, production, sales and freight indicators confirm the same broad reading or qualify it. That requires attention to the definitions and release sources alongside the chart, especially where adjusted or experimental series appear. Useful context, with limits.
The evidence presented supports monitoring consumption alongside these other measures, rather than treating one headline as a full diagnosis of the cycle. If the series broadly reinforce one another, confidence in a general reading of current conditions may rise; if they diverge, the differences deserve explanation. The figures establish the framework for that judgment, but the source text doesn't report detailed values for each line or specify a forecast. Any stronger claim about what comes next would go beyond the evidence provided.