A split signal in AI-related trade
Q2 estimates point to a split in AI-related trade: computer and semiconductor imports together rose, but the increase came from chips while equipment imports edged down. That distinction matters because the combined total can make demand look more uniform than it is. A rise in semiconductor imports alongside a decline in equipment imports suggests different movements within the category, though the data alone don’t establish why they diverged.
Information equipment and software investment also appears to have lost momentum. Imports and domestic investment measure different parts of economic activity, so they shouldn’t be read as interchangeable indicators. Taken together, however, the estimates raise a useful question: is the growth concentrated in components, while spending on broader information systems is slowing? The figures don’t settle that question, but they make the split harder to ignore.
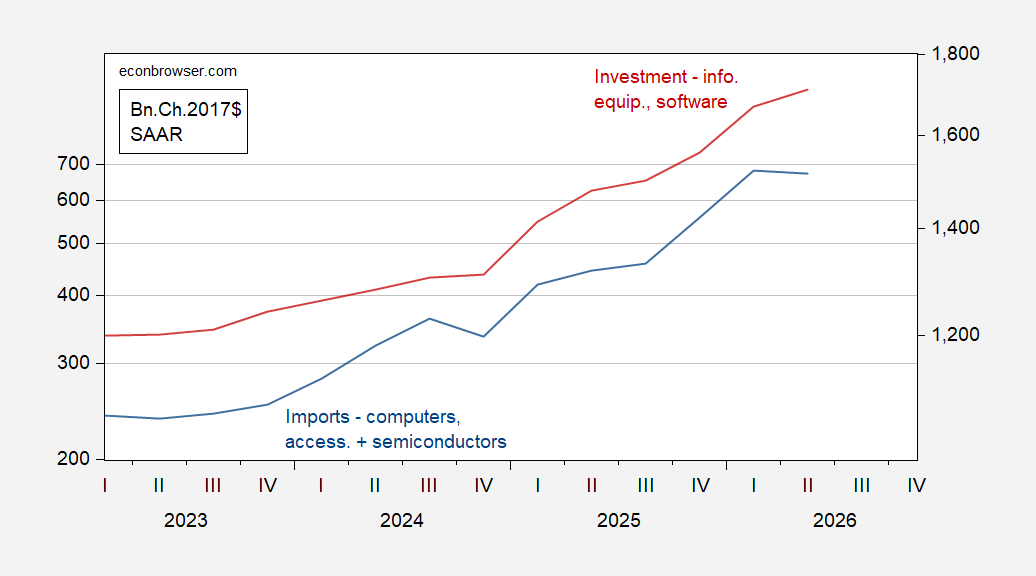
Figure 1: Imports of computers, peripherals and semiconductors (blue, left log scale), and investment in information equipment and software (red, right log scale), in billions of chained 2017 dollars at seasonally adjusted annual rates. Source: BEA 2026Q2 advance release.
What the import measure captures
The import total is an imperfect proxy for AI-related goods because the data don’t isolate products used solely for AI. Computers, peripherals and semiconductors serve many purposes, and the aggregate can’t tell readers how much of the flow supports AI activity specifically. A higher total may be consistent with stronger demand linked to AI, but it doesn’t measure that demand directly. The category is broad by construction.
Prices add another complication. The total combines components whose relative prices have moved differently: over the past year, computer and peripheral import prices rose about 15% faster than software prices, while information equipment prices rose about 8% faster. A simple aggregate can therefore blur changes in quantities and changes in the mix of goods. A Törnqvist approximation would better account for those shifts, though its result would still depend on the accuracy of the price deflators used.
This is more significant than it looks. When the price movements differ across categories, a single inflation adjustment may give a misleading picture of real activity. The chart uses chained 2017 dollars, which helps express the series in inflation-adjusted terms, but the source’s warning about deflators remains relevant. The pattern deserves attention; its precision deserves caution.
The June estimate is still an open piece
Nominal imports were estimated at about $700 billion annualized for Q2 using April and May data. The BEA’s advance estimate is $730 billion, implying its internal June estimate came in slightly above the preliminary May figure. That gap signals that the advance estimate incorporates a stronger June reading than the preliminary data had suggested, but the underlying June report is still pending.
June’s reported data are due August 4. Until then, the quarterly estimate rests partly on an agency estimate rather than a complete set of reported monthly figures. That’s a routine feature of advance releases, but it limits how confidently readers can assign meaning to a difference between the preliminary and advance totals. The next release can clarify the monthly pattern, even if it can’t identify which imported products are being put to AI uses.
Why the mix matters next
The gap between chips and equipment is the more telling signal to watch in the next release. Chip imports rose while equipment imports edged down; whether that divergence persists will help determine if Q2 reflects a temporary shift in the mix or a broader change in the flow of information-related goods. One quarter’s estimate can’t answer that on its own.
If you're working in this space, the practical read is to track the component series alongside investment, rather than treating the headline import total as a direct measure of AI spending. And this is the part most people overlook: a rising component total can coexist with weaker equipment imports and softer investment. The figures describe different links in a chain, and they don’t guarantee that activity at one link will translate into spending at another.
Here's the thing: the estimates offer a signal, not a verdict. The chip increase is clear in the account presented here, while equipment imports and information investment point in a less buoyant direction. That said, the Q2 import estimate still includes an inferred June contribution, and the categories remain too broad to isolate AI demand. More clarity will come from the reported June data and from whether the split continues.
Not a clean boom signal.