The May payroll gain of 72,000 is a strong headline, but it doesn’t settle the question of how much momentum the labor market has. The household survey and ADP measures have lagged the establishment survey, while several measures show real wages falling sharply. Those signals describe different parts of the labor market and use different methods, so disagreement among them calls for caution rather than a quick verdict.
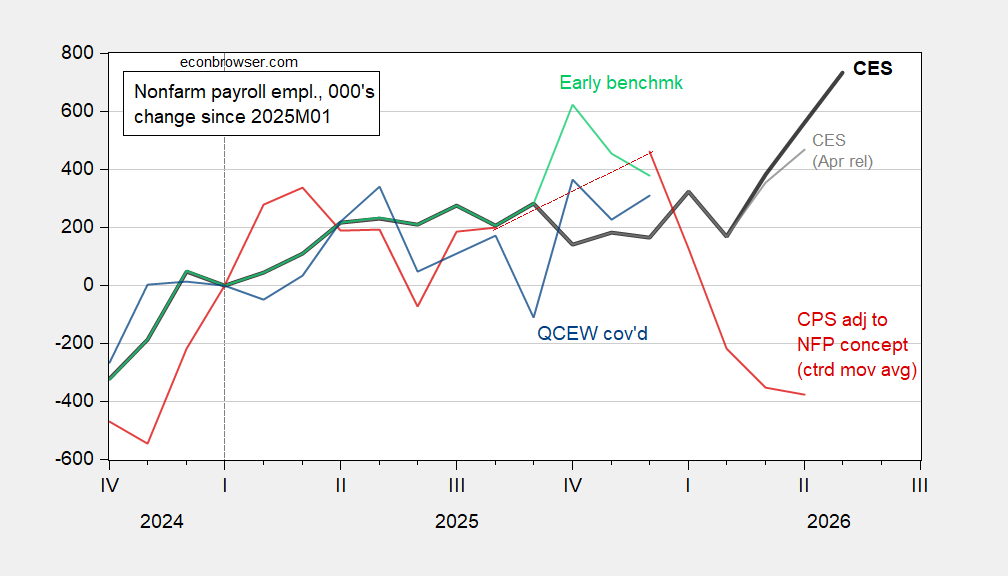
Figure 1: Change in nonfarm payroll employment in thousands, seasonally adjusted. May CES release (bold black), April release (gray), CPS series adjusted to the NFP concept (red, three-month centered moving average), early benchmark (light green), and QCEW covered employment (blue). The author adjusted the QCEW series using X-13 over 2022–2026. Sources: BLS, Philadelphia Fed, and author’s calculations. The lines compare a monthly payroll estimate with survey and benchmark measures that differ in construction and timing. Their spread is a reminder that one month’s reading can give a cleaner headline than the underlying evidence warrants.
April’s payroll estimate was revised noticeably higher, extending the CES series’ upward move. Revisions are part of how monthly employment estimates develop: later information can change the first reading, and a revised number can alter the apparent direction of recent growth. But CES and CPS continue to diverge, leaving uncertainty about the pace of employment growth. The 72,000 May increase also merits context: in 2025, the mean absolute revision from the first to the third release was 53,000. That historical comparison doesn’t predict May’s eventual revision; it does show why the initial figure shouldn’t be treated as settled. This is more significant than it looks: the gap between the headline and the broader set of measures affects how confidently readers can describe the labor market’s direction.
ADP points to slower private hiring
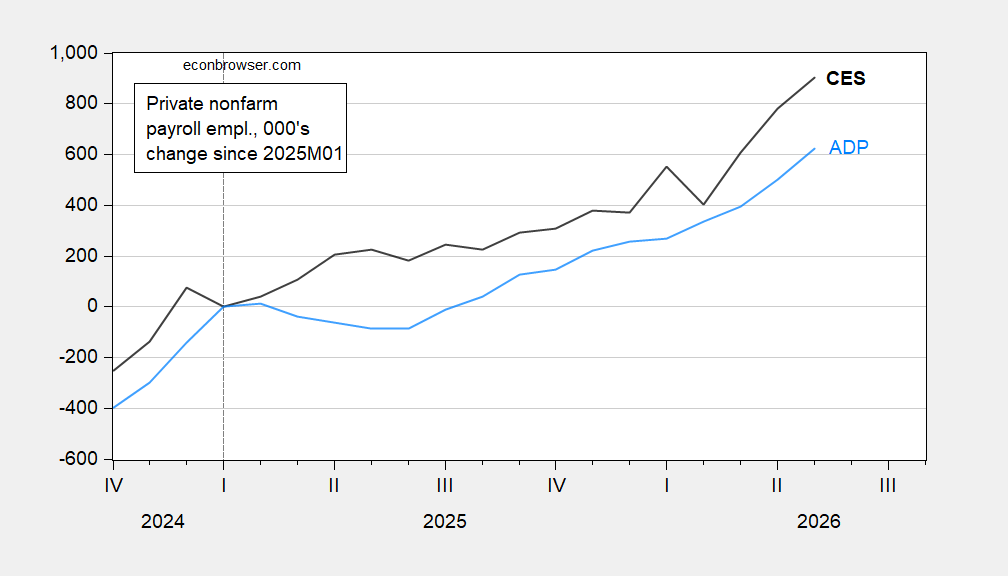
Figure 2: Private nonfarm payroll employment in thousands, seasonally adjusted: CES (black) and ADP (sky blue). Sources: BLS and ADP via FRED. The comparison focuses on private employment, placing two estimates alongside each other rather than treating either as a complete account of the jobs picture. The divergence is useful evidence about uncertainty, though it can’t by itself identify which series better captures the month’s underlying pace.
ADP provides another check on the BLS figures, and its estimates show job additions lagging the CES measure. The two series are separate measures, so a gap between them isn’t proof that one is wrong; it is a reason to look beyond a single estimate. Read together, the series suggest that the May headline may overstate the strength visible across employment indicators. Here's the thing: the comparison speaks most clearly to the breadth of the signal. If you're working in this space, the practical question is whether hiring strength appears across measures, not just whether one survey posts a positive monthly change.
Real wage measures have weakened
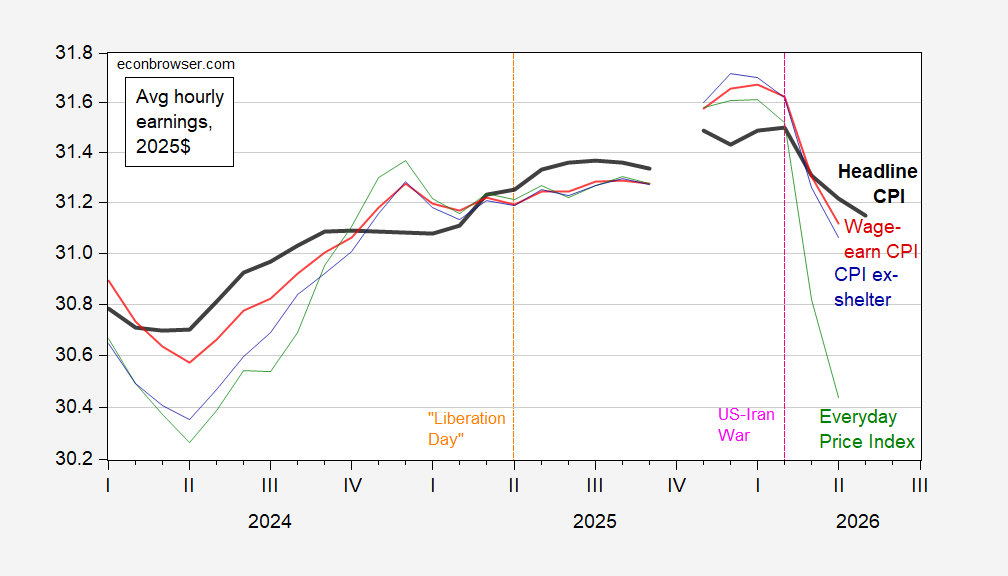
Figure 3: Average hourly earnings in 2025 dollars, deflated by headline CPI (bold black), the CPI for urban wage earners and clerical workers (red), CPI excluding shelter (blue), and the Everyday Price Index (green). May headline CPI is a Cleveland Fed nowcast. Sources: BLS, AIER, Cleveland Fed, and author’s calculations. Each line adjusts hourly earnings using a different price measure, so the size of the estimated real wage change depends partly on which inflation gauge is used. The direction reported here is consistent across several measures, while the exact decline varies.
Real average hourly earnings have fallen sharply since February across several inflation measures. The decline is 1.1% using the headline CPI nowcast and 1.6% through April using the CPI for urban wage earners and clerical workers. Those figures have different endpoints and inflation measures, so they shouldn’t be read as identical estimates of the same period. They do point to a squeeze on measured purchasing power. And yet, a real wage series is an average: it doesn’t tell every worker’s story, or show how employment changes are distributed across households.
The employment report therefore pairs a sizable payroll increase with a clear squeeze on measured purchasing power. That combination matters because job growth and wage growth answer different questions: one concerns the number of payroll positions, while the other concerns what earnings buy after prices are accounted for. A strong payroll headline can coexist with weaker real earnings, leaving households with a less favorable picture than the job count alone suggests. The numbers here are underwhelming when judged as a complete account of labor market conditions. A positive monthly gain is still a gain. But the gap between payroll estimates, the scale of potential revisions, and the wage declines all argue for reading the report as mixed evidence.
What the mixed signals imply
The data don’t establish that employment is contracting, and they don’t support treating the May increase as a definitive measure of sustained strength. Similar sets of labor indicators often differ because they capture employment through distinct surveys, populations, and release schedules. That means a useful reading comes from watching whether the measures converge over time, while recognizing that this report leaves the pace uncertain. One sentence fragment. A strong headline, with caveats attached.
For now, the report’s clearest message is the tension between payroll growth and purchasing power. The CES increase points to added jobs, while the lagging ADP and CPS measures complicate the claim that hiring is broadly strong; real wage declines add a separate pressure on workers’ earnings. The next revisions and subsequent readings will help clarify whether May was representative, but the current figures alone don’t resolve that question. That said, readers can take the 72,000 figure seriously without treating it as the whole story (and this is the part most people overlook). It’s a meaningful data point, framed by uncertainty about both employment growth and real pay.