Growth remains subdued
U.S. real GDP grew at a 1.5% annual rate in the second quarter, according to the Bureau of Economic Analysis. That pace is roughly half the 3.1% historical average, extending the subdued growth seen over the past three quarters. The figure describes the change in total domestic output at an annualized pace; it shouldn’t be read as a forecast that the economy will grow at that rate for a full year. Still, three quarters of comparatively slow growth make this more than a one-quarter curiosity. The economy is expanding, but the pace reported here is modest against its longer-run record.
That distinction matters. A positive growth rate says output increased, while a comparison with the historical average gives readers a sense of how restrained that increase has been. Neither figure, on its own, settles whether households or businesses feel conditions are improving. GDP is an aggregate measure, and the same headline can reflect different experiences across industries and spending categories. The report’s components help explain what supported activity and where some of that support was offset.
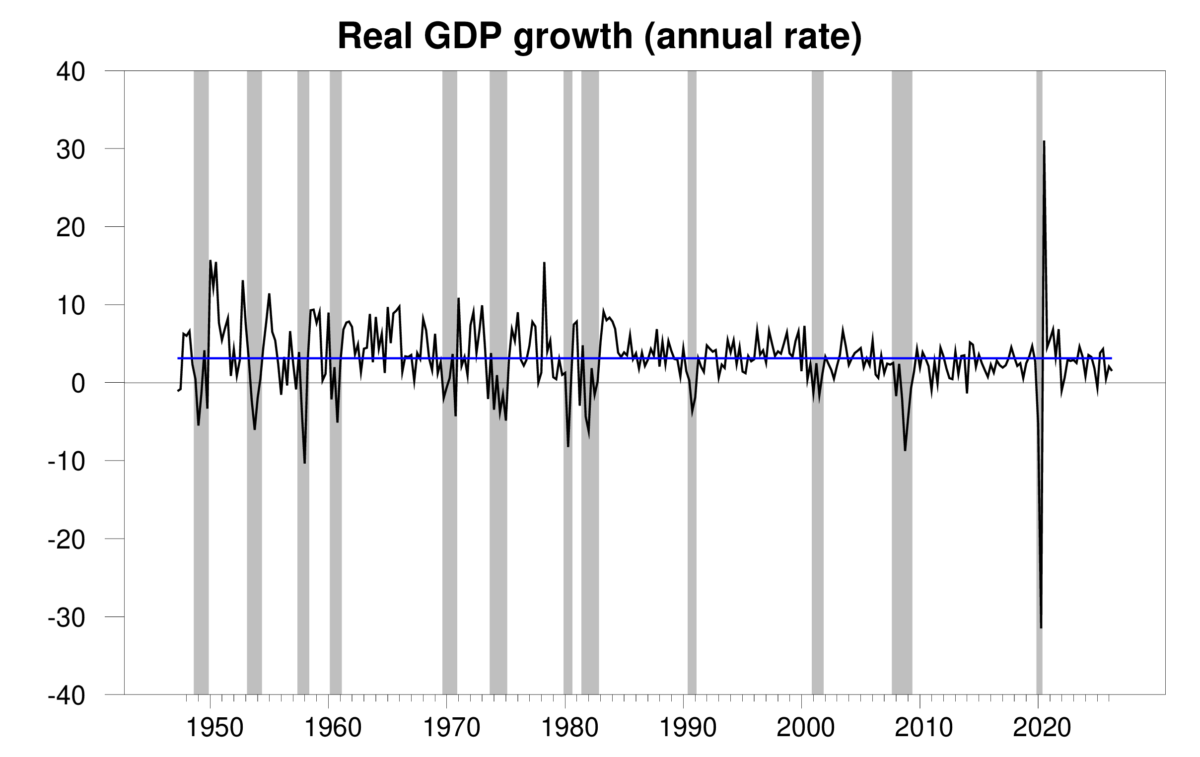
Quarterly real GDP growth at an annual rate, 1947:Q2-2026:Q2, alongside the 3.1% historical average since 1947. Growth is calculated as 400 times the change in the natural log of real GDP from the prior quarter.
The chart puts the latest reading beside the historical average, a useful reference point but not a target the economy must meet each quarter. Quarterly GDP can move unevenly, and annualizing a single quarter’s change makes the pace easier to compare with annual growth rates while also magnifying the impression of short-term movement. The broader pattern described here is therefore more informative than treating 1.5% as a precise statement about what comes next. Growth has been subdued over the past three quarters, and the newest reading continues that run.
The recession indicator offers a separate signal
The Econbrowser recession indicator index stands at 7.0%, little changed from the previous quarter. The latest plotted observation is 2026:Q1, using only GDP data available one quarter after each date; recession shading reflects NBER dates that were not used to construct the index. That timing is central to interpreting the chart: its newest point doesn’t cover the second-quarter GDP figure reported above. The two measures speak to related questions, but they aren’t observations from the same quarter.
An index reading can help organize the evidence, but it shouldn’t be mistaken for a declaration that a recession has begun or that one is imminent. The stated 7.0% is the index’s current value, and its limited change from the prior quarter indicates little movement in that measure. It does not erase the signal from slow GDP growth, nor does it turn slow growth into a recession by itself. A careful read keeps those claims distinct.
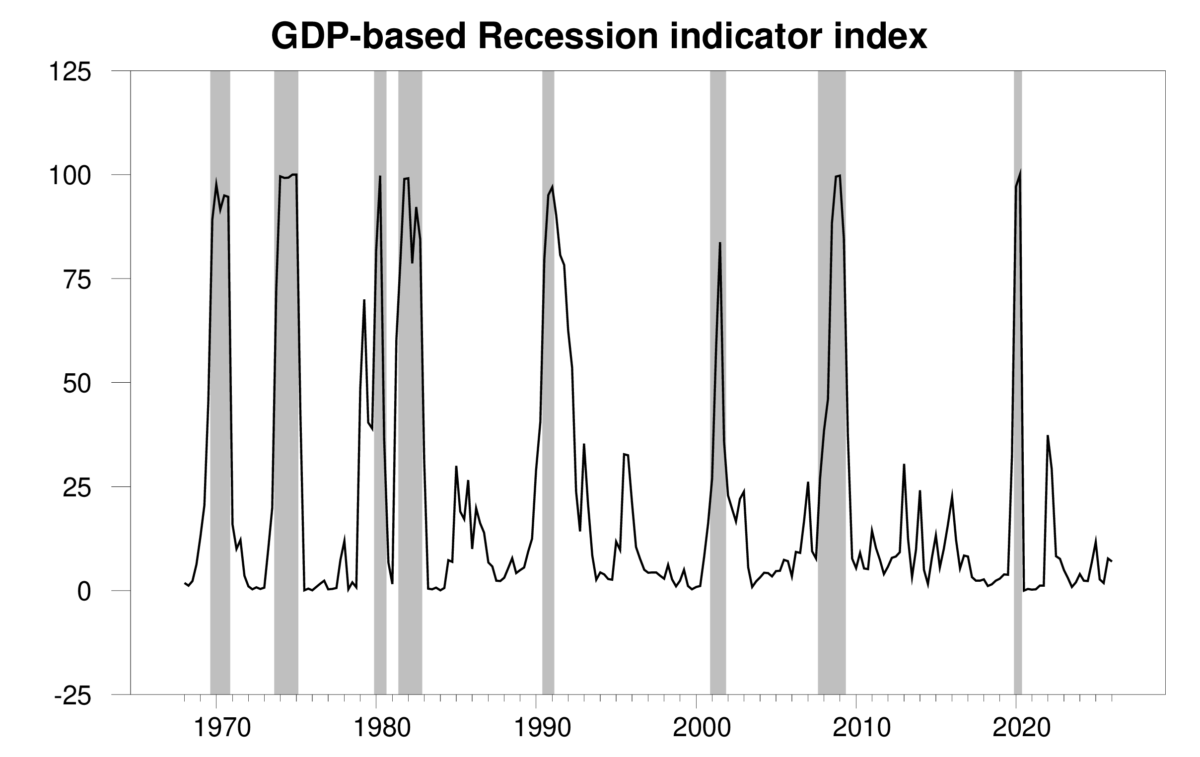
GDP-based recession indicator index. Each date uses GDP figures publicly available one quarter later. The latest date shown is 2026:Q1. Shaded areas mark NBER-dated recessions; those dates were not used to construct the index.
There’s also a built-in lag in the plotted data: each date is evaluated using GDP figures that became public one quarter later. That approach makes the index’s information set clearer, while limiting what it can say about the most recent quarter. Recession shading gives historical context, but the caption states that those dates weren’t used to construct the index. That separation matters when judging the chart’s meaning. It lets readers see how the index compares with past recession dates without implying that those dates generated its readings.
Investment and consumption support activity, with qualifications
Growth drivers echoed the prior quarter. Nonresidential fixed investment, including spending on AI infrastructure, added meaningfully to activity. But imported components limited its net contribution to U.S. GDP, which measures domestic production. Consumption was also strong, with some sales supplied from inventories. The mix points to support from business spending and household demand, alongside an accounting distinction that can be easy to miss when looking at headline investment.
GDP counts production within the United States. When a business investment project uses imported components, the spending can appear in investment while the associated imports are subtracted elsewhere in the calculation. That doesn’t mean the project had no economic value; it means gross spending and the contribution to domestic production aren’t the same thing. Here’s the thing: investment can look substantial at the point of purchase while contributing less to measured U.S. output when some of its inputs were made abroad.
The reference to AI infrastructure gives one example of the investment category, but the source doesn’t specify how much of total investment it represents. That limits what can responsibly be inferred about the durability of this support. A spending category can lift current activity, yet the headline alone doesn’t show whether the pace will persist or how much domestic output the spending generates. The numbers here are underwhelming in aggregate, even with meaningful support from investment.
Consumption was strong, but the note about inventories adds a qualification. Some sales were supplied from goods already held in inventory, rather than from newly produced goods in the period. That detail can affect how sales translate into current production, though the source doesn’t provide a breakdown of the effect. If you’re working in this space, it’s a reminder to read the components together: a strong spending measure doesn’t automatically mean every part of the supply chain is producing at the same pace.
Not a clean, one-directional story.
Energy adds uncertainty to the outlook
Energy markets add another uncertainty. Oil prices have swung sharply on settlement rumors concerning the Strait of Hormuz. The ongoing Middle East conflict looks like a downside factor for U.S. growth and an upside risk to inflation. That combination complicates the reading of an economy already growing below its historical average: weaker growth and price pressure can coexist, and the source identifies both as relevant risks.
Oil price volatility can matter through more than one channel. If energy becomes more expensive, households and businesses may face higher costs; if uncertainty persists, it can also make planning harder. Those are general ways energy shocks can affect an economy, not a claim that either effect has already changed the GDP figures reported here. And yet, the direction of risk described in the source is clear: the conflict may weigh on growth while pushing inflation higher.
The rumors themselves shouldn’t be treated as confirmed developments. The source links price swings to settlement rumors, which leaves open whether those expectations will hold or how markets will respond to subsequent information. The same caution applies to the growth outlook: the reported quarter and the recession index provide evidence about recent conditions, while the energy risk introduces uncertainty about what follows. What this means for you is that the headline growth rate deserves attention, but so do its composition, the index’s timing, and the risks that could change the path ahead.
For now, the report describes an economy that’s still growing, but at a subdued pace. Investment and consumption provided support, with imports and inventory effects shaping how that support appears in domestic output. The recession indicator barely moved, though its latest observation predates the second-quarter GDP estimate. Those facts don’t resolve the outlook. They do make a simple reading of the headline less convincing.