Growth is positive, but the level still matters
U.S. core GDP is growing faster than headline GDP, yet remains below its 2023–24 trend. That distinction matters: a faster pace of growth can indicate improving momentum without erasing the gap between current activity and the path the economy had been on. The mix behind that growth matters too. AI-related investment has been prominent, while gains in household wealth tied partly to equity markets may be supporting consumption.
Jim’s assessment describes headline GDP as growing slowly but steadily. Final sales to private domestic purchasers tell a stronger story because they focus on spending by households and businesses in the United States, excluding changes in inventories and trade that can make headline GDP more volatile. Even so, the latest level still trails the prior trend, the February Congressional Budget Office projection and the May Philadelphia Fed Survey of Professional Forecasters median. Stronger growth in this measure is useful evidence about underlying demand, but it doesn’t mean the economy has returned to its earlier trajectory.
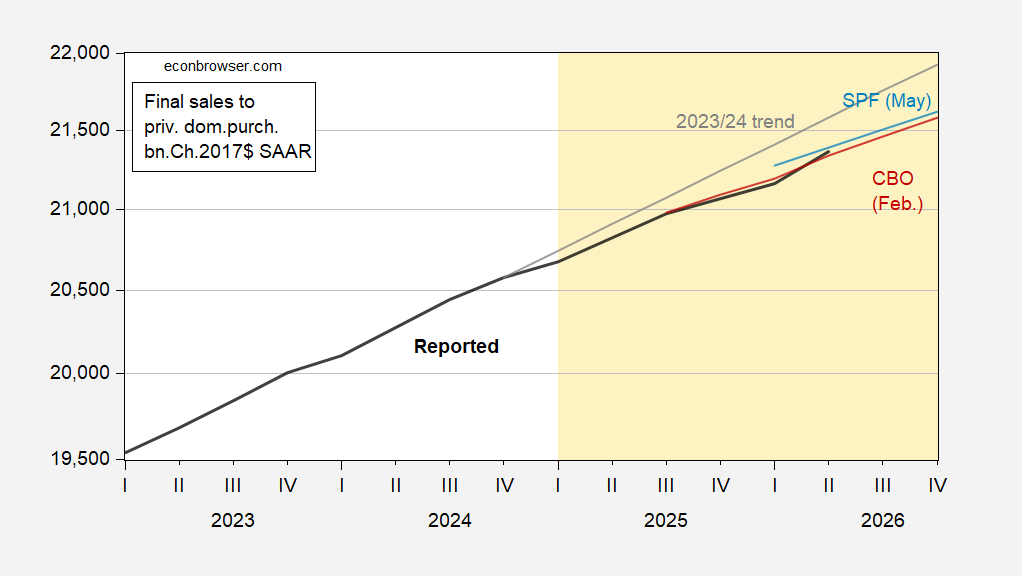
Figure 1: Final sales to private domestic purchasers (bold black), 2023/24 trend (gray), CBO February projection (red), and May SPF median forecast (light blue), in billions of chained 2017 dollars, seasonally adjusted at annual rates. Source: BEA 2026Q2 advance release, February CBO Budget and Economic Outlook, Philadelphia Fed, and author’s calculations.
AI spending’s net contribution
Direct AI-related spending appears roughly offset in the national accounts outside Q2: contributions from investment in information equipment and software are counterbalanced by computer and semiconductor imports. That accounting decomposition, detailed here, suggests the investment surge hasn’t translated one-for-one into domestic GDP growth. Investment adds to domestic output when it reflects production at home, while imported equipment enters the accounts as a subtraction from GDP. The resulting arithmetic can make a large investment push look smaller in the domestic growth total.
That doesn’t mean the spending is economically irrelevant. Equipment and software investment can support capacity and activity beyond the quarter in which it’s recorded, although the figures here don’t establish how large or lasting those effects will be. The key point is narrower: headlines about AI investment alone don’t show how much of that spending is accruing to domestic production. The import offset makes the composition of the boom as important as its size.
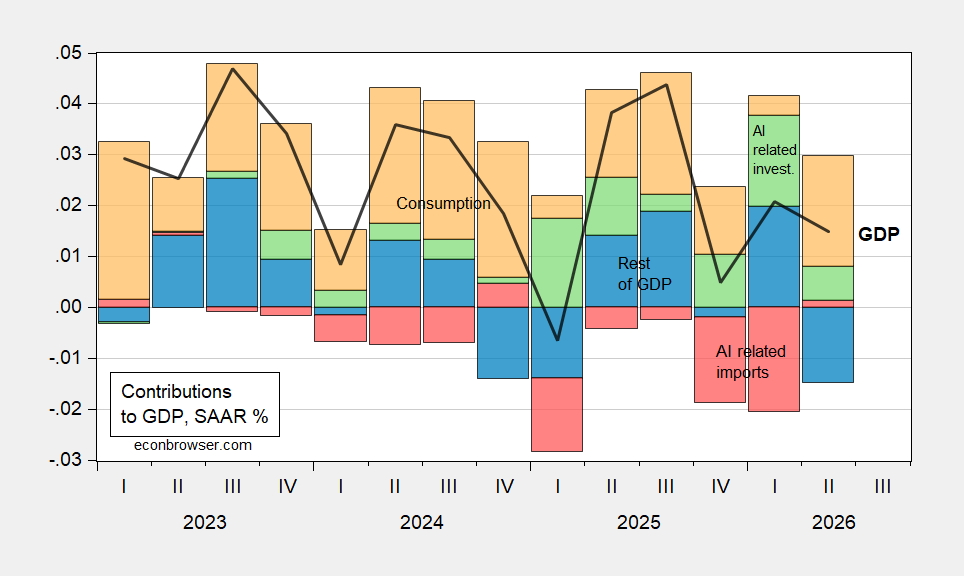
Figure 2: GDP growth at an annual rate (bold black); contributions from information equipment and software investment (green), computer and semiconductor imports (red), consumption (yellow), and the rest of GDP (blue). Source: BEA and author’s calculations.
Wealth effects remain part of the demand picture
The AI boom may also support demand through asset values. Bigot and Espic (2026) estimate that wealth gains accounted for about half of 2025’s 2% consumption growth, distinguishing wealth effects across higher- and lower-income households. Real household net worth rose 5% that year. This suggests asset gains were more than a market-side story: they may have helped support spending, though the estimated contribution doesn’t mean every household experienced the same effect.
If real household wealth were flat in 2026, the author estimates consumption growth would be about one percentage point lower, trimming GDP growth by roughly two-thirds of a percentage point. That estimate illustrates how a change in household balance sheets could feed into demand; it isn’t a direct measurement of what consumers will do. A 7% S&P 500 decline from June to December would be one scenario consistent with flat real wealth; it’s an assumption, not a forecast. The Bigot and Espic analysis examines the relationship between stock market valuations and U.S. consumption.
The distribution of those wealth effects also matters. Households with greater exposure to rising asset prices may respond differently from households whose spending depends more on current income. The analysis distinguishes higher- and lower-income households, a useful reminder that an aggregate consumption figure can conceal different experiences. For readers tracking demand, the implication is that market gains may support spending, but the strength of that channel depends on who holds the assets and how they respond.
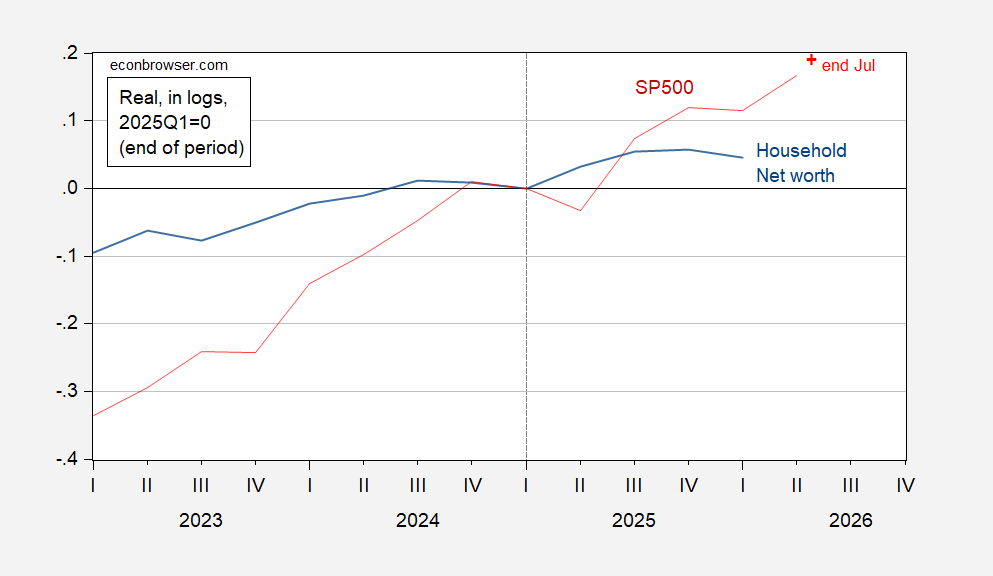
Figure 3: Real household net worth (blue) and the S&P 500 (red), log scale with 2025Q1 set to zero, end of period. Net worth is deflated by the PCE price index; July PCE is a Cleveland Fed nowcast. Source: Federal Reserve Board Flow of Funds, BEA, S&P/Dow Jones via FRED, Cleveland Fed, and author’s calculations.
That leaves equity prices as a meaningful swing factor for aggregate demand, in part because valuations reflect expectations for AI. The accompanying comparison tracks unweighted total returns for the Magnificent 7 against the S&P 500. It gives readers a way to see how returns for a group of large companies compare with the broader index, while keeping the relationship between stock performance and household wealth in view. A comparison of returns alone, however, doesn’t establish how much of any change in consumption comes from those shares.
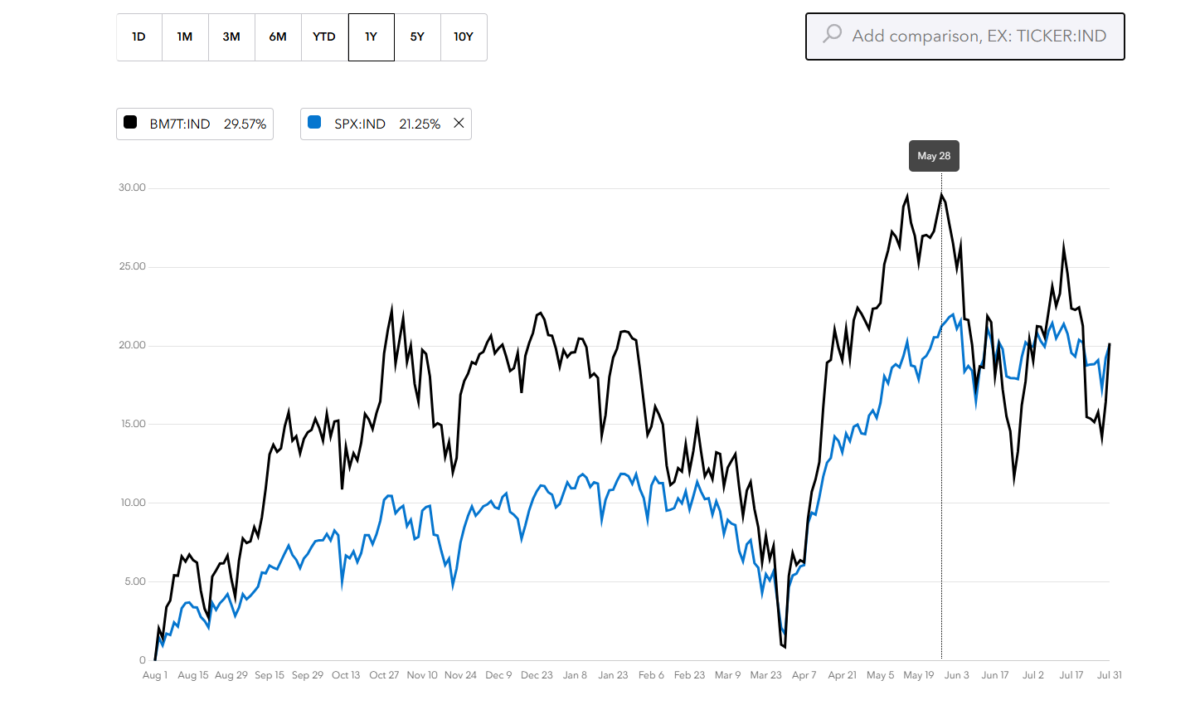
Source: Bloomberg, accessed August 1, 2026.
What to watch in the demand outlook
For now, the read is that strong core growth coexists with a below-trend level, while equity-linked wealth and AI investment help sustain demand. The two supports work through different channels: investment contributes directly to measured output, subject to the import offset, while wealth may influence consumption through household spending decisions. Neither channel guarantees that current growth will persist. Here's the thing: the data describe support for demand, not a promise of its durability.
This is more significant than it looks because a growth rate can improve even as the economy remains short of its prior path. And yet, the present mix leaves demand exposed to shifts in investment and markets. If you're working in this space, watch whether domestic investment contributions continue to outweigh import costs and whether household spending holds up if wealth gains slow. The estimates offer a framework for judging those developments, not a precise map of what comes next. A weaker market could matter for consumption, but the scenario described here is conditional.
That uncertainty deserves emphasis. Asset prices can move quickly, while household spending responses may vary; national accounts also collect several forces into broad categories. The numbers here are underwhelming as evidence of a full return to trend, even as the stronger private domestic sales measure points to continued demand. A gap remains. The next assessment will depend on whether growth keeps closing it and on how much of that growth comes from domestic activity rather than imported equipment or wealth-supported consumption.