Real yields are doing more of the work
The latest rise in Treasury yields appears to reflect higher real rates more than a fresh increase in expected inflation. That distinction matters because nominal yields combine compensation for expected inflation with the real return investors demand, alongside premiums for uncertainty and risk. Stronger economic activity can lift credit demand and real yields even when inflation expectations hold steady.
That reading is suggestive, not conclusive. A market yield is a price shaped by several forces at once, and the available measures don’t isolate each one cleanly. The useful question is whether the recent move looks like a broad repricing of inflation, a higher real return demanded by investors, or some combination.
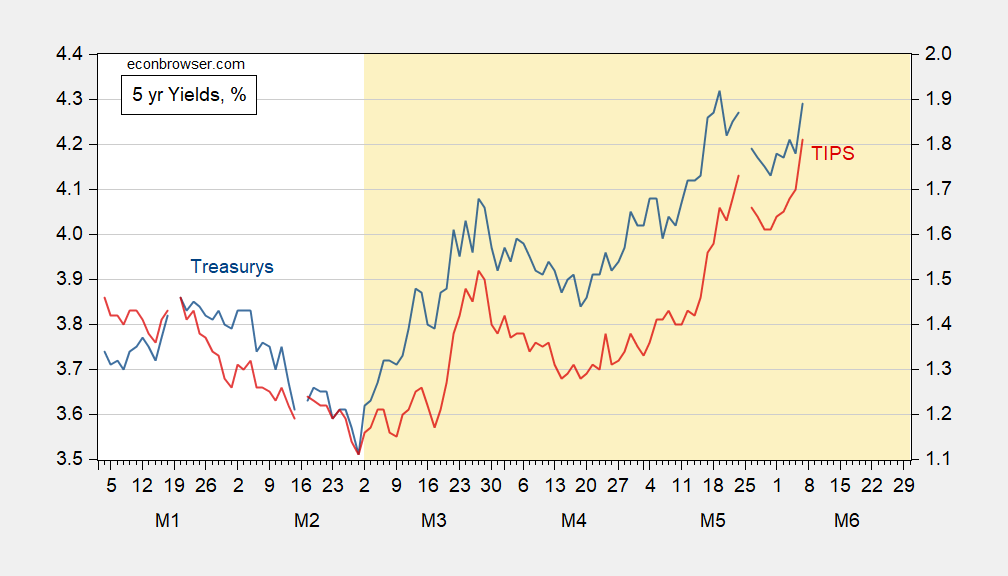
Figure 1: Treasury 5 year yield (blue, left scale), TIPS 5 year yield (red, right scale), both in %. Source: Treasury via FRED.
The five-year nominal yield hasn’t set a new peak, but the real yield has. That split is the central evidence for the article’s interpretation: the inflation-adjusted return has reached a new high while the nominal rate has not. It suggests investors are demanding more real compensation, though it doesn’t establish why. Expectations for growth, the supply of credit, and the premium investors require for holding longer-dated securities can all affect real yields.
D’Amico, Kim, and Wei’s measures of five- and 10-year expected inflation show the May 29 reading at the same level as February 27, the day before the war began. That comparison offers a useful reference point: on these measures, expected inflation hadn’t risen between those dates. But an unchanged reading doesn’t mean inflation concerns have disappeared, nor does it capture every market participant’s view. It’s one piece of evidence, with a defined window and a particular measurement approach.
Term premia in nominal and real rates could still be masking some of the inflation component, so that comparison doesn’t settle the question. A term premium is the extra compensation investors may demand for bearing interest-rate risk over time; changes in it can shift yields even if the expected path of short-term rates is stable. Separating these forces is difficult, which makes a confident single-cause explanation premature. The numbers here are underwhelming as proof of an inflation shock.
The curve has steepened, while credit risk remains limited
The yield curve offers another point of comparison: it’s no longer inverted, unlike just before the war. A curve’s shape reflects how yields differ across maturities, and a shift from inversion to a positive slope can arise from changes in short-term rates, longer-term rates, or both. The chart provides snapshots at several dates, but the shape alone doesn’t identify the cause of the change.
That matters for interpreting the rise in longer-term yields. If long rates are climbing while the curve steepens, investors may be reassessing the longer-run return they require, even as the short end follows a different path. Here’s the thing: a steeper curve can fit more than one economic story, so it shouldn’t be treated as a clean signal of stronger growth or of a particular policy outlook.
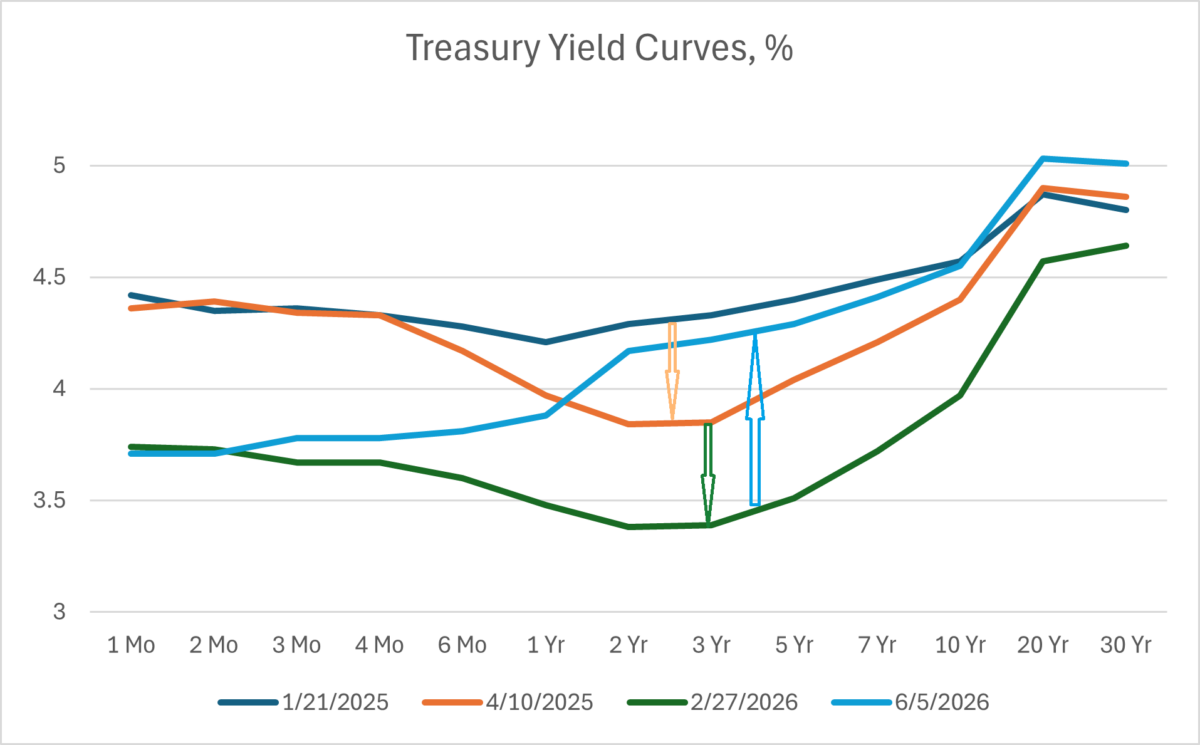
Figure 2: Yield curve for US Treasurys as of 1/21/2025 (blue), as of 4/10/2025 (tan), as of 2/27/2026 (green), and as of 6/5/2026 (sky blue), all in %. Source: Treasury.
Higher long-term yields could also reflect default risk, though credit default swaps suggest that risk remains small. CDS prices offer a market-based gauge of the cost of insuring against default, but they aren’t a direct forecast and depend on assumptions about recovery and other contract terms. Their signal is still relevant here: if perceived credit risk had risen sharply, that could help explain higher yields, but the cited pricing doesn’t point to a pronounced increase.
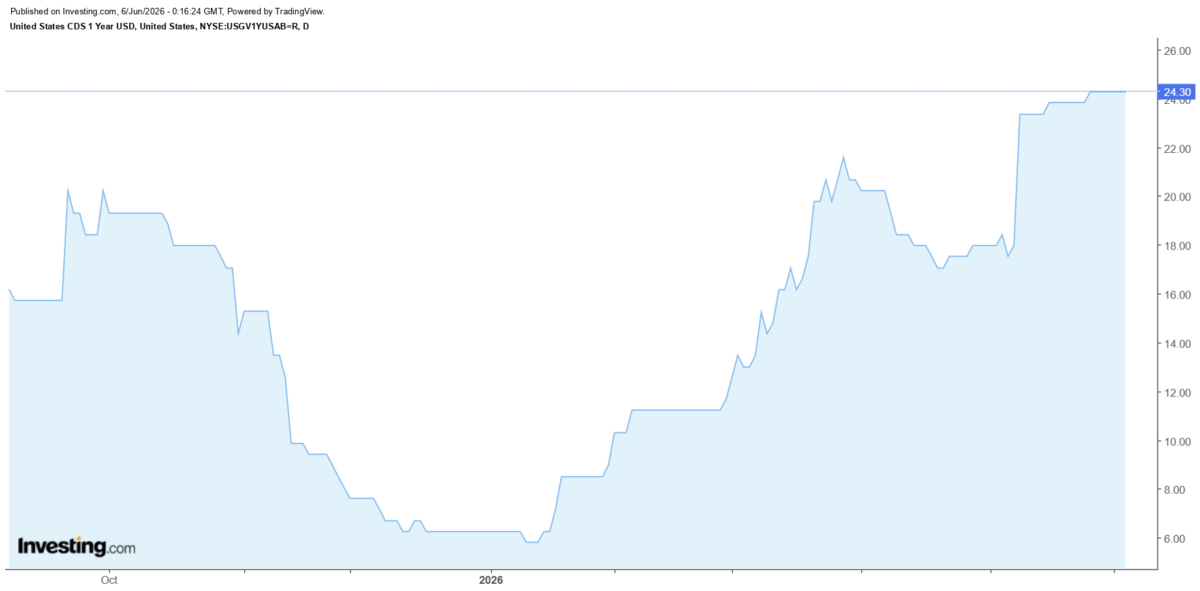
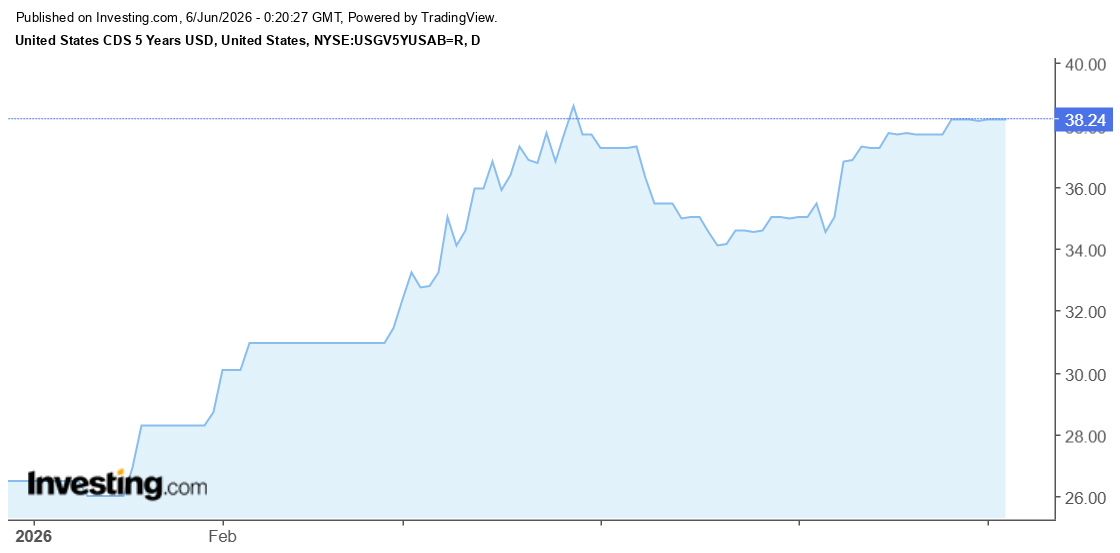
At a 40% recovery rate, the five-year CDS rate implies a 0.64% probability of default. That figure is conditional on the recovery assumption; a different assumption would change the implied probability. It’s a small estimate, and the article presents it as evidence that perceived default risk remains limited.
What the evidence can and can’t establish
Taken together, the yield comparison, inflation expectations, curve shape, and CDS pricing point toward higher real rates as the clearest explanation for the recent move. They don’t prove that inflation risk played no role. Term premia complicate the comparison, and each indicator captures a different part of the market’s pricing.
This is more significant than it looks because the distinction changes how readers interpret the same headline movement in Treasury yields. If you're working in this space, the practical takeaway is to track the components and their assumptions, rather than treating a higher nominal yield as an automatic sign that inflation expectations have jumped. And yet. The evidence remains a snapshot, not a verdict on what comes next.
The yield move therefore looks more consistent with higher real rates than a pronounced shift in inflation expectations or perceived credit risk. Whether that pattern persists depends on how those components evolve; the figures here don’t establish a future path. For now, the most defensible account is narrow: real yields have risen, while the cited inflation and credit indicators show less movement.