What the nowcasts are signaling
Rising gasoline prices could keep near-term inflation readings firm, and Cleveland Fed nowcasts suggest the latest estimates may not be overstating that pressure. They remain provisional, though.
That distinction matters. A nowcast is an estimate of economic data before the official reading is published, built from information already available at the time. It can help readers assess the direction of travel, but it isn't a substitute for the eventual government release. New inputs, revisions, or differences between the data used in a model and the prices captured in official measures can change the picture.
The current signal is narrow but relevant: gasoline prices are rising, and the estimates described here incorporate that movement. This is more significant than it looks when attention is focused only on core inflation. Headline indexes include energy, so a sharp enough move in gasoline can affect the overall reading even if prices elsewhere are changing more slowly.
How gasoline reaches inflation measures
Gasoline is a visible household expense, and its price can change quickly. That makes it an immediate contributor to consumer price measures, though the effect depends on how prices move across the period covered by the index. A rise late in a month, for example, may affect that month's reported average differently from a rise that persists throughout the month. The source doesn't provide a forecast for the size of the effect, so the direction of pressure is clearer than its eventual magnitude.
Energy prices can also matter beyond the direct cost of filling a tank. Businesses that use fuel in transport or other operations may face higher costs, and those expenses can influence prices elsewhere if firms pass them through. But that chain isn't automatic: companies may absorb some costs, adjust other expenses, or change prices at different times. The gasoline series alone can't establish whether broader price pressure is spreading.
That's why the distinction between headline and core measures is useful. Headline CPI and the PCE deflator include energy prices; their core counterparts exclude food and energy. Core readings can therefore offer a view of price movements without the direct volatility of those categories. They don't show the full cost of living, though, and they don't tell us whether a gasoline increase will later affect the prices of other goods and services.
What the estimates cover
The estimates incorporate Energy Information Administration gasoline price data through July 22, along with oil prices. The July 23 monthly nowcast covers CPI and core CPI; the June and July year-over-year estimates cover the PCE and core PCE deflators.
Those are different comparisons, and readers shouldn't treat them as interchangeable. A monthly measure compares a recent period with the one immediately before it, making it sensitive to short-term shifts. A year-over-year measure compares prices with the same period a year earlier, so it reflects a longer span of changes. Each answers a different question, and each can give a different impression of current momentum.
The chart labels also matter. The CPI figure presents the indexes in logs with January 2025 set to zero; that normalization makes changes over time easier to compare visually, but it doesn't show the index's dollar level or an inflation rate by itself. The PCE figure uses the same log presentation and base. Its June and July values are year-over-year nowcasts, while the CPI figure's July value is a monthly nowcast. A reader comparing the two should keep those differences in view.
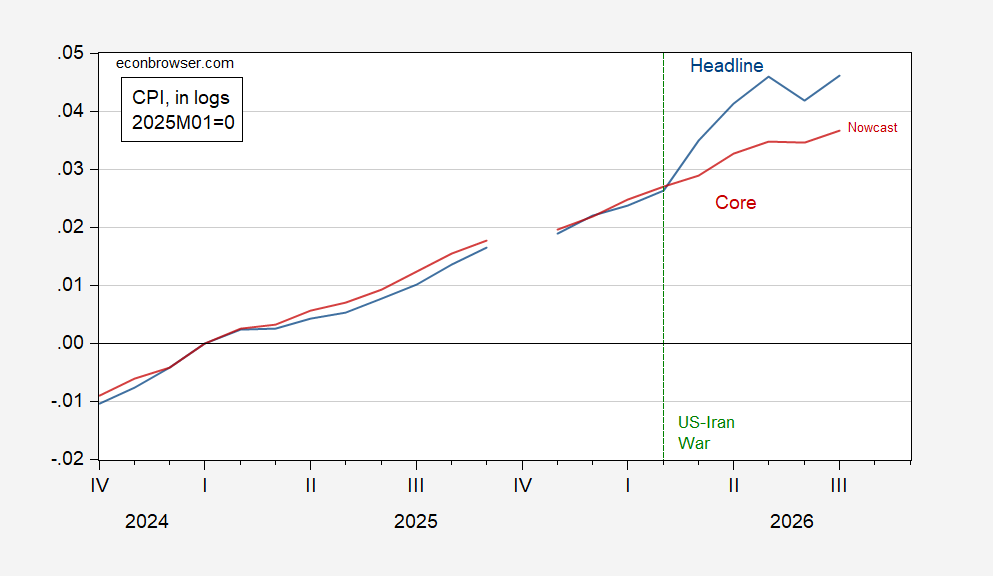
Figure 1: CPI (blue) and core CPI (red), in logs with 2025M01=0. July is the July 23 monthly nowcast. Source: BLS, Cleveland Fed, and author’s calculations.
The CPI and core CPI lines let readers see whether the overall index is moving differently from the measure that removes food and energy. If the headline line is firmer while core is more subdued, energy may be contributing to the gap. The chart can suggest that relationship, but it can't identify every cause of the movement or tell us how the published data will compare with the estimate.
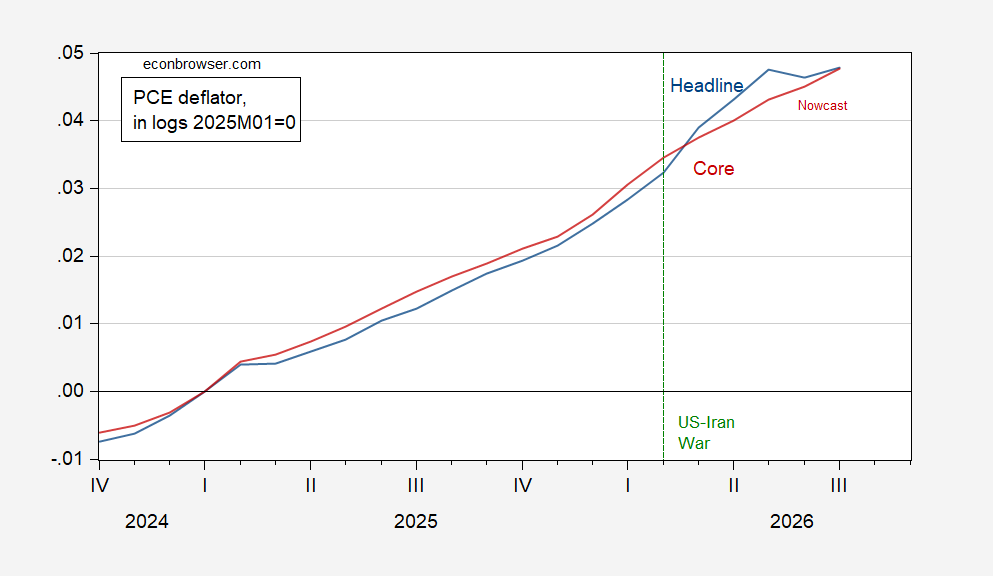
Figure 2: PCE deflator (blue) and core PCE deflator (red), in logs with 2025M01=0. June and July are July 23 year-over-year nowcasts. Source: BLS, Cleveland Fed, and author’s calculations.
CPI and PCE are separate measures, with different construction and coverage. The figures therefore offer related evidence, not duplicate readings. The source doesn't specify how much of any projected movement comes from gasoline, oil, or other components, so it would be too strong to attribute the full change to fuel.
Why a nowcast needs confirmation
Gasoline prices continue to climb in the accompanying series. That trend supports the possibility of firm readings, but the nowcasts will need confirmation in published data.
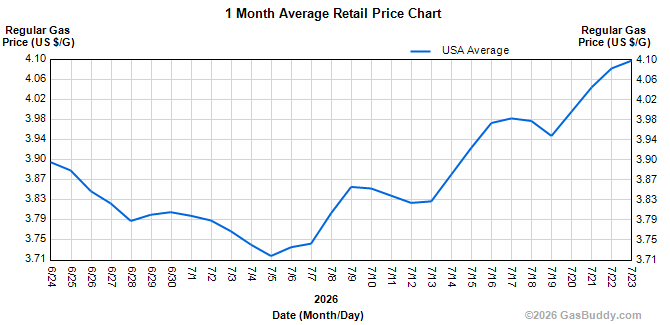
The gasoline chart is useful as a timely indicator, but it isn't the inflation report itself. Price series can differ in their timing, geographic coverage, and method of collection. A model that combines several inputs can provide an early read, yet the official indexes are built from their own data and methods. The comparison is informative precisely because it can be checked once the published figures arrive.
Here's the thing: a rising fuel series can support a firm headline reading without proving that underlying inflation has accelerated. And yet, dismissing the move as temporary before seeing the data would be premature. The source's cautious framing is appropriate: the signal points toward pressure, while the final reading remains open.
For anyone tracking the figures, the next useful step is to compare the published CPI and PCE readings with these estimates, then check whether headline and core measures moved together or apart. If you're working in this space, keep the reference periods straight as well: monthly CPI and year-over-year PCE estimates describe different windows of price change. The timing can alter the story.
(And this is the part most people overlook.) A nowcast's value isn't limited to whether it lands exactly on the later release. It can show how incoming information, such as gasoline prices, is shaping expectations before the official data are available. But its usefulness depends on remembering what it measures and what it leaves unresolved.
Provisional, but worth watching.