Official growth figures show a clear slowdown
China’s second-quarter growth slowed on the official measure, though the data and alternative estimates give different readings of how much momentum the economy has lost. Gross domestic product rose 4.3% year over year, down from 5% in the first quarter and below the government’s 4.5–5% target range for the year. On a seasonally adjusted annualized basis, quarterly growth was 3.6%, compared with 5.3% in Q1.
Those figures describe different comparisons. The year-over-year rate compares output with the same quarter a year earlier, while the annualized quarterly rate takes the change from the previous quarter and expresses it as if that pace continued for a full year. Neither measure, on its own, tells the whole story: the first can reflect conditions from many months earlier, and the second can make a single quarter’s movement look more persistent than it proves to be.
The direction is more straightforward than the precise scale: both official comparisons point to slower growth in Q2. That matters because a headline rate can remain positive even as the pace of expansion eases. The numbers here are underwhelming against the stated target range, though one quarter’s data don’t establish how the full year will turn out.
Demand and investment are part of the pressure
Weak household demand and lower fixed investment contributed to the deceleration. These are distinct parts of economic activity: household demand reflects spending by consumers, while fixed investment concerns spending on longer-lived assets. When both are soft, growth can face pressure from current spending as well as from projects that would add to productive capacity.
The source doesn’t quantify either contribution, so it’s not possible to say from these figures how much each factor explains. Nor do the numbers identify why households are spending less or why fixed investment has weakened. Those gaps matter: similar movements in the headline data can arise from different underlying conditions, and the policy or business implications depend on which forces are driving them.
Here’s the thing: a slowdown in demand can feed through to businesses’ decisions, while weaker investment can reflect caution about future activity. That doesn’t mean the two figures prove a broader cycle or establish what comes next. It does mean readers should look beyond GDP and ask whether the spending and investment components are improving or continuing to drag on growth.
Alternative estimates widen the debate
BOFIT’s alternative calculations put Q2 growth at 3.1% year over year, versus 3.2% in the prior quarter, and show a wider estimated range of 1.2–4.7%. That reading suggests a much smaller change between quarters than the official figures imply. Its estimated range also signals substantial uncertainty around the alternative calculation; it shouldn’t be treated as a single precise replacement for the official rate.
Alternative GDP estimates can be useful when analysts want to test whether a headline measure lines up with other available indicators. But they’re estimates built through a different method, and a gap between them and official data doesn’t, by itself, establish which measure is more accurate. The comparison is most useful as a prompt to examine the methods and the underlying indicators, especially when the signals disagree.
BOFIT’s chart tracks its alternative GDP estimates alongside official figures. A chart can make the difference in direction and scale easier to see, but it can’t resolve the reasons for that difference. The range, the choice of comparison period, and the series used all shape the picture a reader takes away.
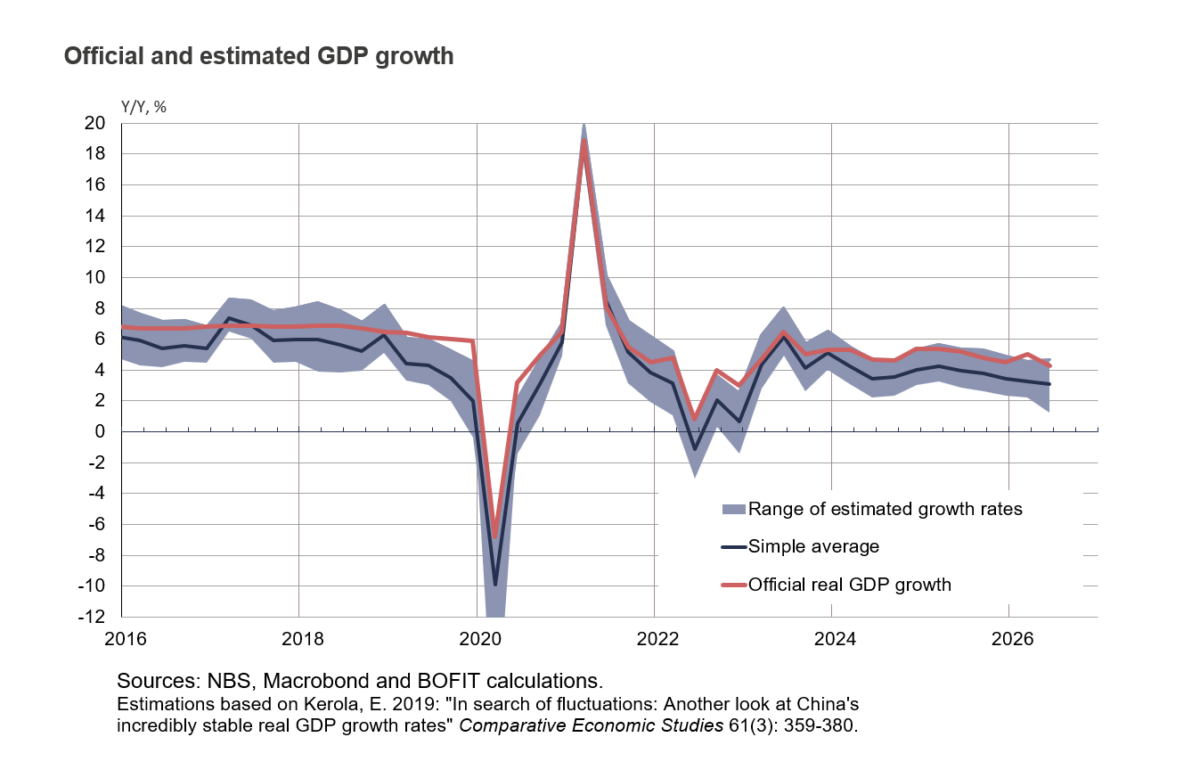
(And this is the part most people overlook.) A disagreement between measures isn’t just a contest over which headline to quote; it changes how confidently a reader can describe the economy’s pace. If you’re working in this space, the useful question is what each estimate includes and how its assumptions affect the result. Without that detail, the difference is evidence of uncertainty, not a verdict.
Forecasts provide a separate reference point
Forecasts offer another benchmark, but they aren’t observations of current activity. The IMF raised its 2026 China growth projection by 0.2 percentage points to 4.6%, and its 2027 estimate by 0.1 points to 4.1%. These revisions are changes to projections, not confirmation that growth has already reached those rates.
The distinction matters when comparing a forecast with quarterly GDP data. A forecast covers an expected future period and depends on assumptions about how activity develops; a quarterly release reports an estimate of what has already happened. The IMF’s revisions therefore provide context about expectations, while the Q2 figures speak to the recent pace. They answer related questions, but they aren’t interchangeable.
The figures also leave a gap between the current official reading and the revised annual projection. That gap doesn’t prove a particular path of recovery or continued weakness. It does show why readers should separate what the latest data report from what forecasters expect across a longer period.
What the indicators can and can’t establish
The San Francisco Fed’s China Cyclical Activity Tracker incorporates import data, but it only runs through Q4. The source doesn’t specify a year for that endpoint, so the tracker shouldn’t be presented as a current Q2 reading. Its stated implication is narrower: it also points to official growth estimates running above alternative measures.
Import data can offer a different window on economic activity because they capture cross-border purchases rather than GDP as a whole. Still, an indicator that incorporates imports doesn’t cover every part of domestic output, and a series ending in Q4 can’t settle what happened in the second quarter discussed here. Useful context, with a timing limit.
And yet, the convergence in one respect is notable: both BOFIT’s calculations and the tracker are described as pointing to official growth estimates above alternative measures. That supports caution when reading the official rate as a complete account of momentum. It doesn’t establish that the official figure is wrong, or tell us how large the underlying difference should be.
Implications for the growth outlook
The immediate takeaway is a slower official Q2 reading alongside weaker household demand and fixed investment, with alternative measures indicating lower growth than the official figures. Taken together, those signals make the quality and breadth of growth worth watching. They don’t, however, provide enough information to determine whether the slowdown is temporary or likely to persist.
For the next assessment, the useful evidence would be whether household demand and fixed investment regain strength and whether newer indicators narrow or widen the gap between official and alternative estimates. The source provides no later data, so any claim about the next quarter would go beyond what’s established here. For now, the picture is mixed: the official economy is still growing, but the pace has eased, and the alternative readings are lower.
That’s the tension in the data. The target range and the IMF forecasts give readers reference points, while the Q2 release and BOFIT estimates raise questions about the strength of current momentum. A single quarter can’t settle those questions. The next set of comparable evidence will matter more than treating any one estimate as the final word.