Industrial growth remains narrow
Industrial production grew 0.1% month over month, while manufacturing output was unchanged. The report describes the industrial result as ahead of the cited 0.2% Bloomberg consensus, though those figures appear inconsistent: a 0.1% increase is below, not above, a 0.2% forecast. The manufacturing figure, by contrast, was weaker than expectations for a 0.1% gain. Taken at face value, the split points to slight growth in the broader industrial measure alongside a pause in factory production, but the comparison with consensus needs to be read cautiously.
That distinction matters because industrial production covers more than manufacturing. A positive headline can coexist with flat factory output when other components contribute to the monthly change. The figures therefore don't establish that manufacturing has regained momentum; they show only that the broader measure edged higher while factories were unchanged over the month. One month is a limited basis for judging a turn in activity, especially when the reported moves are this small.
For readers tracking the business cycle, the useful question is whether the gap between total industrial production and manufacturing persists. A broader measure can help show whether activity outside factories is offsetting weakness in goods production. But without more detail on the components behind this month's change, the headline alone can't explain what drove the increase. The numbers here are modest, and the distinction between a slight gain and a flat reading shouldn't be made to carry more weight than it can bear.
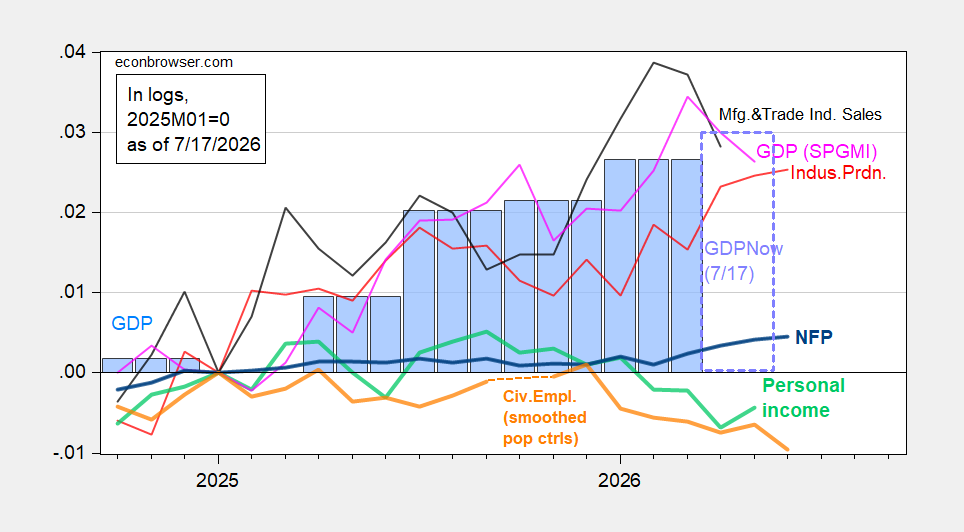
Figure 1: NFP employment (bold blue), civilian employment with smoothed population controls (bold orange), industrial production (red), personal income excluding current transfers in Ch.2017$ (bold light green), manufacturing and trade sales in Ch.2017$ (black), and monthly GDP in Ch.2017$ (pink), GDP (blue bars), GDPNow nowcast of 7/10 (light blue box), all log normalized to 2025M01=0. Source: BLS via FRED, BLS, Federal Reserve, BEA 2026Q1 3rd release, S&P Global Market Insights (nee Macroeconomic Advisers, IHS Markit) (7/1/2026 release), and author’s calculations.
The first chart places industrial production alongside labor, income, sales, and GDP measures, putting the monthly factory result in a wider economic frame. Its series are normalized to a common starting point, which helps readers compare changes over time without treating different measures as if they shared the same units. That view can reveal whether production is moving in step with other indicators or diverging from them. It can't, by itself, settle which measure best captures current momentum.
That broader comparison is useful because economic indicators don't all move together or arrive with the same timing. Employment and income can offer information about household and labor conditions, while production and sales speak more directly to business activity. A single industrial reading may look less consequential when set beside a range of indicators, or more telling if it marks a sustained departure from them. Here's the thing: the chart supplies context, but the brief source doesn't provide enough detail to attribute any divergence to a particular cause.
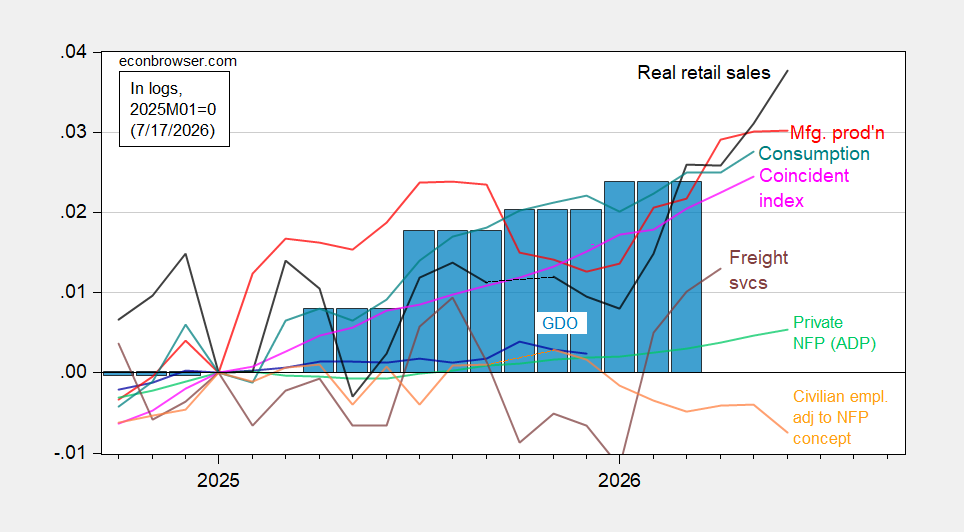
Figure 2: Civilian employment adjusted to NFP concept smoothed population controls, using experimental controls for 2025 (bold orange), manufacturing production (red), ADP private nonfarm payroll employment (light green), real retail sales, CPI deflated (black), freight services indexes (brown), and coincident index in Ch.2017$ (pink), GDO (blue bars), all log normalized to 2025M01=0. Source: BLS, ADP via FRED, Philadelphia Fed, Bureau of Transportation Statistics, Federal Reserve via FRED, BEA 2026Q1 3rd release, and author’s calculations.
The second chart adds employment, retail sales, freight, and a coincident index to the comparison with manufacturing production. These series offer different angles on activity: employment captures labor demand, inflation-adjusted retail sales track household purchases, and freight measures provide a view of goods movement. Similar systems of indicators are often read together because any single series can be noisy or reflect only part of the economy. And this is the part most people overlook: the lines share a normalized starting point, but that doesn't make them interchangeable measures.
If you're working in this space, the practical takeaway is to separate the direction of a reading from its scale and from the confidence you can place in a month-to-month move. The production increase was small, and manufacturing was flat. The charts may help show how those results fit alongside other measures, but they don't turn a modest monthly change into a clear signal about the next quarter.
Growth nowcasts diverge
GDPNow puts first-quarter growth at a 1.7% annualized rate, below the New York Fed’s 2.7% nowcast and Goldman Sachs’ 2.4% tracking estimate. That gap warrants attention, though GDPNow had been fairly accurate at a similar point before the pandemic, roughly two weeks before the advance GDP release. The incoming production data add context, but the estimates remain far apart.
These estimates are not identical readings of a finished quarter. Nowcasts and tracking estimates update as information arrives, and different models can place different weight on incoming data. A spread between them is a sign of uncertainty about the current picture; it isn't proof that one estimate is right or that the economy has shifted sharply. The production report adds another observation to assess, but the source doesn't establish how much it changes any of the three estimates.
That said, the disagreement makes the next set of data more consequential for interpreting the quarter. If you're following the estimates, watch whether incoming indicators narrow the gap or leave the picture divided. The historical comparison offered for GDPNow gives some reason to take its past performance into account, but one earlier episode doesn't guarantee similar accuracy now. A useful reading is therefore provisional: growth estimates point to expansion, yet the range between them is wide enough to counsel restraint.
What the signals imply
This is more significant than it looks, but only as a reminder that the monthly evidence is mixed. Industrial production posted a small gain, factory output paused, and the growth trackers disagree by a full percentage point between the lowest and highest estimates cited. Those facts can coexist. They describe different slices of activity and different ways of estimating growth, not a single settled account of economic momentum.
The immediate outlook depends on whether the broader pattern confirms or contradicts this month's readings. A continued gap between industrial production and manufacturing would invite closer attention to what is supporting the headline measure. Likewise, convergence among the nowcasts would make the growth picture easier to interpret, while continued dispersion would leave more room for uncertainty. No conclusion about those future readings is available from the figures presented here.
For now, the most defensible reading is restrained: production barely advanced, manufacturing was unchanged, and estimates of first-quarter growth remain spread apart. A small monthly increase can be a useful data point. It isn't a verdict on the direction of the economy. And yet.