A rebound with a timing caveat
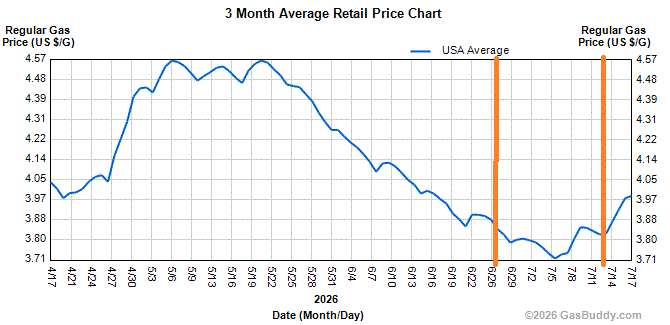
Michigan’s July consumer survey points to a rebound in sentiment, but its field dates put a limit on how current that reading can be. Responses were collected from June 23 to July 13, when gasoline prices were still relatively low. Prices have risen again since much of that period, so the survey captures household views formed under conditions that had already begun to change by the time the results were reported.
That timing matters because consumers encounter fuel prices directly and often, making them a visible part of the cost of living. A change at the pump can influence how people describe both their present finances and the broader economy, even when it doesn't tell the whole story about household budgets. The survey doesn't establish how much of any change in sentiment is tied to gasoline, though its collection window gives a clear reason to treat the final reading as provisional.
This is more significant than it looks: a rebound in a survey is useful evidence, but it isn't a real-time account of what households think today. If prices rose after many respondents had answered, their responses can't reflect that later experience. The next reading will offer a better check on whether views changed as the price backdrop shifted.
How the confidence measures compare
The chart places Michigan’s sentiment measure alongside confidence indexes from the Conference Board and Gallup. Because the measures use different scales, the figure standardizes each one against its own average and volatility over January 2021 through February 2025. That helps readers compare movements in the series, but it doesn't make their survey methods or underlying questions identical.
The comparison is useful as a check on whether the indicators are moving in similar directions. When they diverge, the gap can signal differences in timing, questions, or who responds; it shouldn't be read as proof that one measure is right and another is wrong. Each index offers a separate view of consumer confidence, and the chart's standardized values show relative movement rather than a common level of confidence.
The chart also marks “Liberation Day” and the start of the U.S.-Iran war. Those markers provide reference points for reading the series over time. Their presence doesn't, by itself, show that either event caused a particular movement in sentiment. Establishing that would require more evidence than a timeline comparison alone.
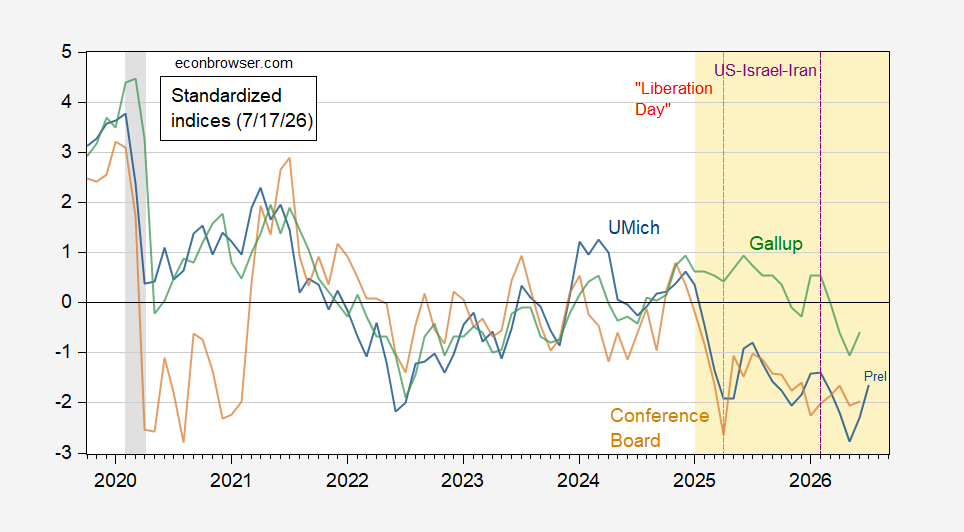
Figure 1: University of Michigan economic sentiment (blue), Conference Board Confidence Index (brown), and Gallup confidence (green), each demeaned and divided by its standard deviation for January 2021–February 2025. Dashed orange line: “Liberation Day.” Dashed green line: start of the U.S.-Iran war. Source: University of Michigan, Gallup, Conference Board, and author’s calculations.
Survey method and response bias
Hsu has discussed potential web-response bias in the Michigan survey. The concern is relevant because survey results depend not only on the questions asked, but also on who answers and how they answer. If people who respond online differ in meaningful ways from those who don't, the measured sentiment may not fully represent the wider population.
That possibility is a methodological question, not a finding that the reported rebound is wrong. Readers should keep it in view when interpreting short-term changes, especially when those changes are being compared with indexes based on different surveys. The available information here raises the issue but doesn't quantify its effect on the July result.
Hsu discusses web-response bias in the Michigan survey.
Inflation expectations and the next reading
Michigan also reported consumers’ expected CPI inflation over the coming year. That measure adds a different dimension to the sentiment story: it records what respondents expect prices to do, rather than how they assess economic conditions more broadly. The two can move together, but they aren't interchangeable, and the material here doesn't establish a direct link between them.
The next reading will show whether consumers’ inflation outlook shifted as gasoline prices climbed again. If expectations rise, that would indicate a change in reported views during the later survey period; it wouldn't, on its own, explain why those views changed or predict what inflation will be. If they don't rise, that would also be informative, though it wouldn't erase the timing caveat around the July responses.
Here's the thing: expectations are worth watching because they show how households interpret the price environment, but a single survey measure can't settle the question of where inflation is headed. The chart provides a record of the Michigan one-year measure and marks the same two events shown in the sentiment comparison. Read it as context for the next update, not as a stand-alone forecast.
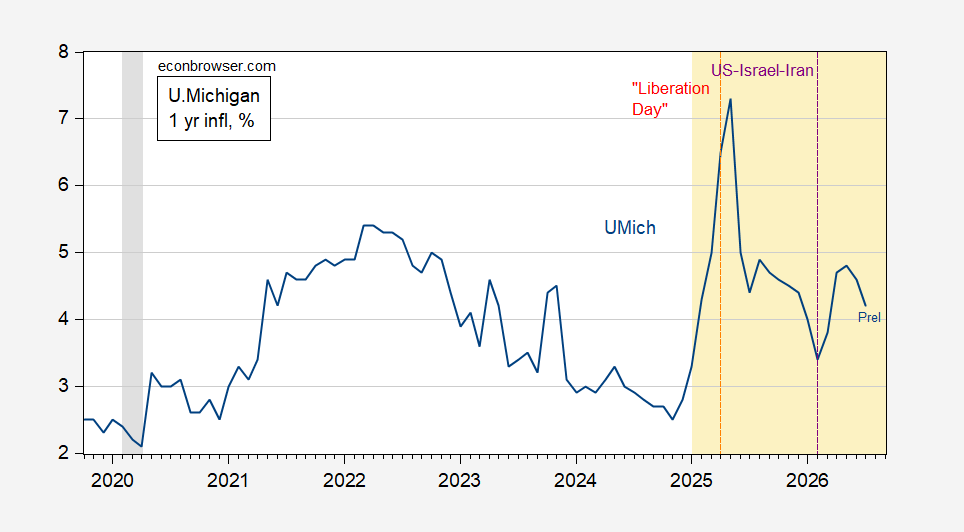
Figure 2: University of Michigan one-year expected CPI inflation (blue). Dashed orange line: “Liberation Day.” Dashed green line: start of the U.S.-Iran war. Source: University of Michigan.
What to watch next
Gasoline prices provide a practical test of whether the survey's timing affected the picture. The price chart below offers recent context for the period discussed, while the next Michigan reading will indicate whether consumers’ reported sentiment and inflation expectations changed as prices rose again. Neither chart alone can isolate the effect of fuel prices on household views.
If you're working in this space, the distinction between a survey’s field dates and its publication date is easy to overlook (and this is the part most people overlook). A result can be new to readers while reflecting answers collected under an earlier set of conditions. That said, the July survey still records what respondents reported during its actual collection window.
For now, the rebound is a signal to follow, with the price backdrop and survey method shaping how much weight it can carry. The next reading should clarify whether the shift in gasoline prices coincided with a change in consumer views. A useful update. But not the final word.